
GEO Tutorial: Publishing a Raster to ArcGIS Online
Required Resources
- ArcGIS Online (June 2021 update, organizational account with publisher privileges)
- ArcGIS Pro (v. 2.7)
Featured Data Sources
Nautical Chart: Mississippi Sound and approaches Dauphin Island to Cat Island (# 11373), accessible using the nautical chart locator: https://charts.noaa.gov/InteractiveCatalog/nrnc.shtml
Overview
Raster files are frequently used in geospatial operations. They are typically used as basemaps but can also be used as other, independent data layers. Rasters compatible with ArcGIS are available in multiple formats, including GeoTIFF, ASCII Grid, Binary Terrain, Bathymetric Attributed Grid, MrSID, Lidar, and many more.
In this tutorial, a georeferenced nautical chart in a KAP format is used as an example illustrating how to publish a raster file to ArcGIS Online. KAP files are also known as BSB Chart Image Files or Raster Navigational Charts (RNC) and are developed by the National Oceanic and Atmospheric Administration (NOAA).
ArcGIS Online offers numerous advantages over traditional desktop GIS environments, and, for many users, it has become the preferred option for sharing, creating, and analyzing geospatial data. This is especially easy if you need to display and analyze vector datasets. However, publishing raster datasets to ArcGIS online requires an extra step. More specifically, you need to transform your rasters to tile layers or compressed KML files outside of the ArcGIS Online environment.
An option to add rasters, including the KAP files, directly to ArcGIS Online exists, if you have access to the ArcGIS Image extension. If not, the functionality is limited to sharing raster files with an authorized group of users and giving them an option to download the file. Any further operations or basemap display modifications require use of desktop GIS software. This is true not just for the KAP files but all raster formats used in GIS. Therefore, the process presented in this tutorial can be successfully used to incorporate other types of raster layers into ArcGIS Online web maps.
To perform the steps listed below, you can use any georeferenced raster file you have available. Keep in mind that this tutorial is designed to work with the provided data, and, if you decide to use your own datasets, the steps, figures, and results could vary. In this case, it is recommended that you download the KAP nautical chart at https://charts.noaa.gov/InteractiveCatalog/nrnc.shtml.
This tutorial focuses on publishing rasters to ArcGIS online as tile layers, as this is the most standard way of incorporating rasters into your online maps or applications.
Step 1. Download the nautical chart
If you are using your personal georeferenced raster file, you can skip step 1 and proceed to step 2. However, if you would like to use the KAP file example and closely follow the figures and steps presented below, you need to visit the NOAA chart locator page and download nautical chart number 11373.
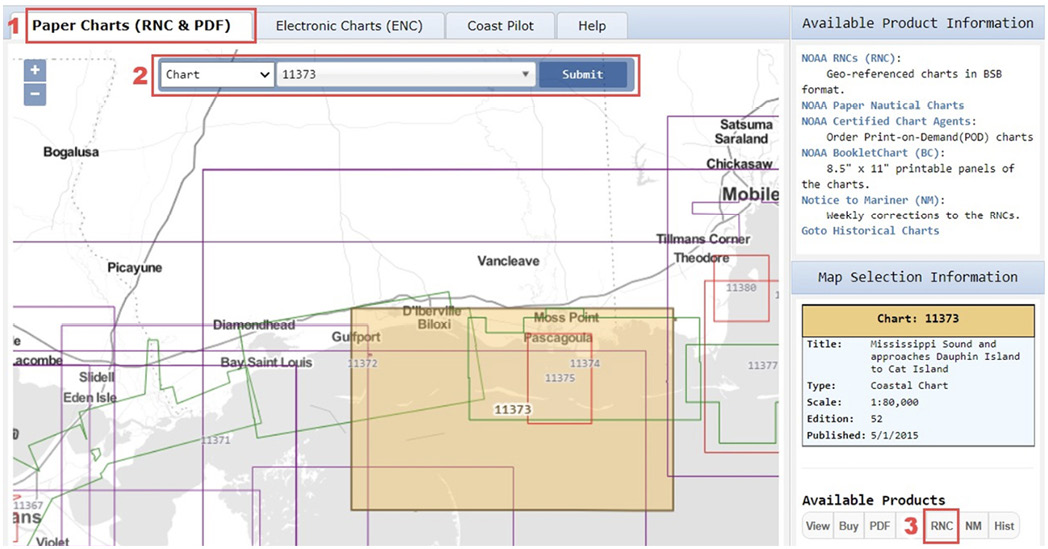
When opening the chart locator page, the Electronic Charts (ENC) tab is selected by default. However, you need to choose the Paper Charts (RNC & PDF) tab to be able to access georeferenced raster charts.
Next, using the drop-down menu, select the Chart option and enter the chart number (in this case, 11373). After you press Submit, the map will automatically zoom in to the selected chart and display various chart information.
From the list of the available products, click on the RNC button. The User Agreement form will automatically display for you to review.
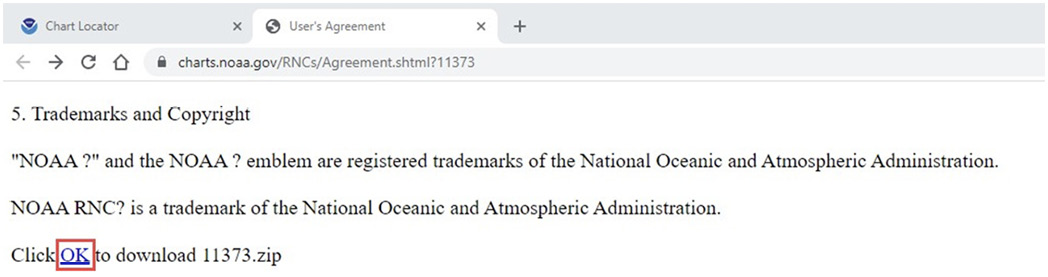
The data download link will be listed at the very bottom of the page. Scroll down and click the OK link to download the zipped file.
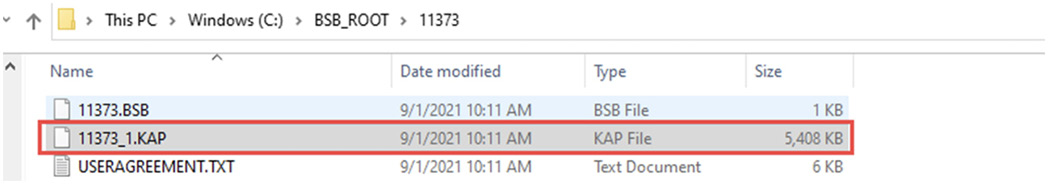
Once downloaded, extract the content of the zipped folder to a directory on your local drive that you will easily remember. Review available datasets.
The KAP file will be available under the subfolder named after the selected chart (in this instance, 11373). Now, you are ready to add it to the ArcGIS Pro project.
Step 2. Add the KAP file to ArcGIS Pro and verify the location
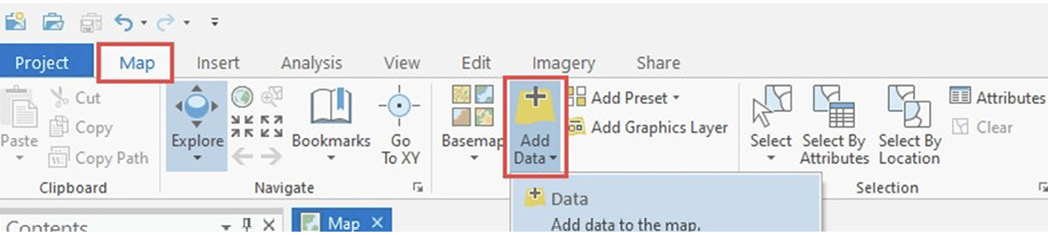
Open ArcGIS Pro and add the downloaded KAP file (or your georeferenced raster) to a new project (Map tab > Add Data > Data). When prompted, click Yes to build pyramids for the 11373_1.KAP file. This step is recommended because it will improve the display performance of the KAP raster at different zoom levels.
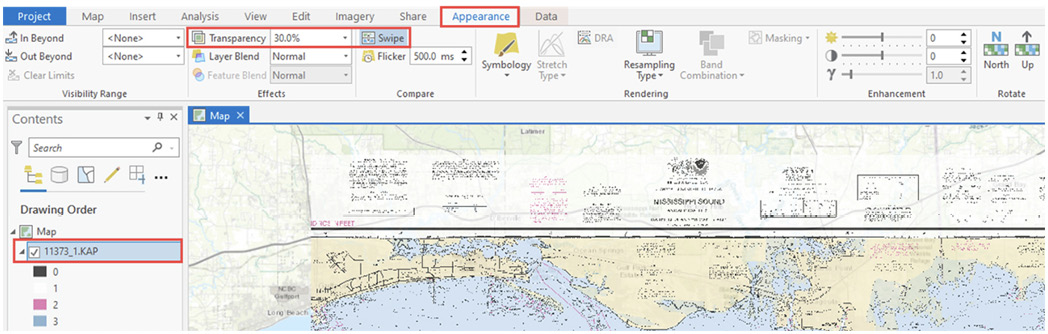
Zoom in to the added raster layer (right-click on the layer name > Zoom To Layer) and verify that the KAP file displays in a correct location. An easy way of examining spatial location is by using the swipe button or by changing the transparency of the layer so that the image can be compared to the basemap. Select the Appearance tab and click on the Swipe button or use the Transparency slider to reduce opacity of the KAP layer. In this instance, the swipe option might be particularly useful, as it can help you to temporarily hide the nautical chart border.
Step 3. Publish a web tile layer
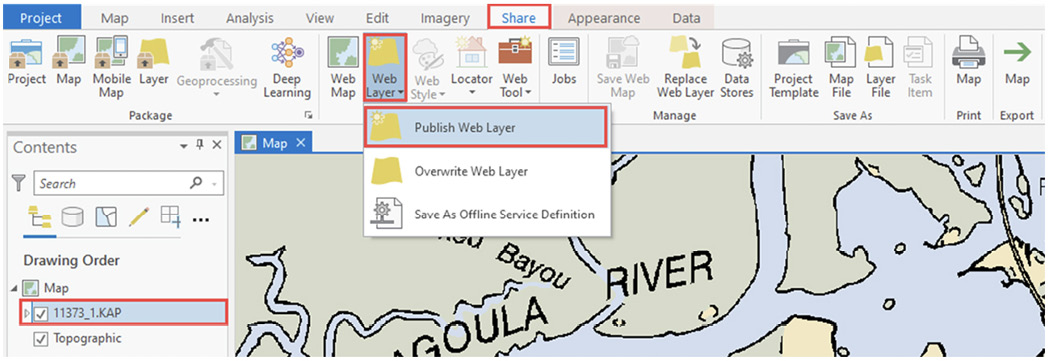
Every layer available in your project window can be published to ArcGIS Online. In this case, you are going to publish a single raster layer. In the Contents pane, make sure that 11373_1.KAP is selected. Click on the Share tab, expand the Web Layer options, and select the Publish Web Layer button. In case this button is grayed out, verify that you are signed in to your ArcGIS Online account, by using the Sign In menu, located in the upper-right corner of the ArcGIS Pro project window.
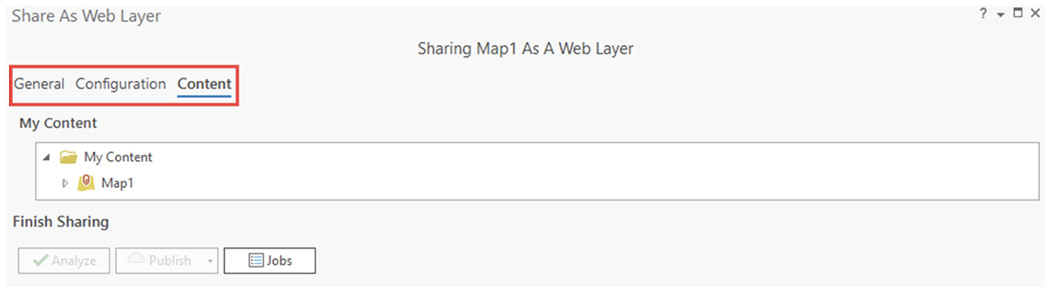
The Share As Web Layer pane will open on the right-hand side of your project window. Note three tabs on top of the pane window: General, Configuration, and Content. In this instance, the third tab, named Content, can be skipped, but the information for the first two tabs needs to be provided.
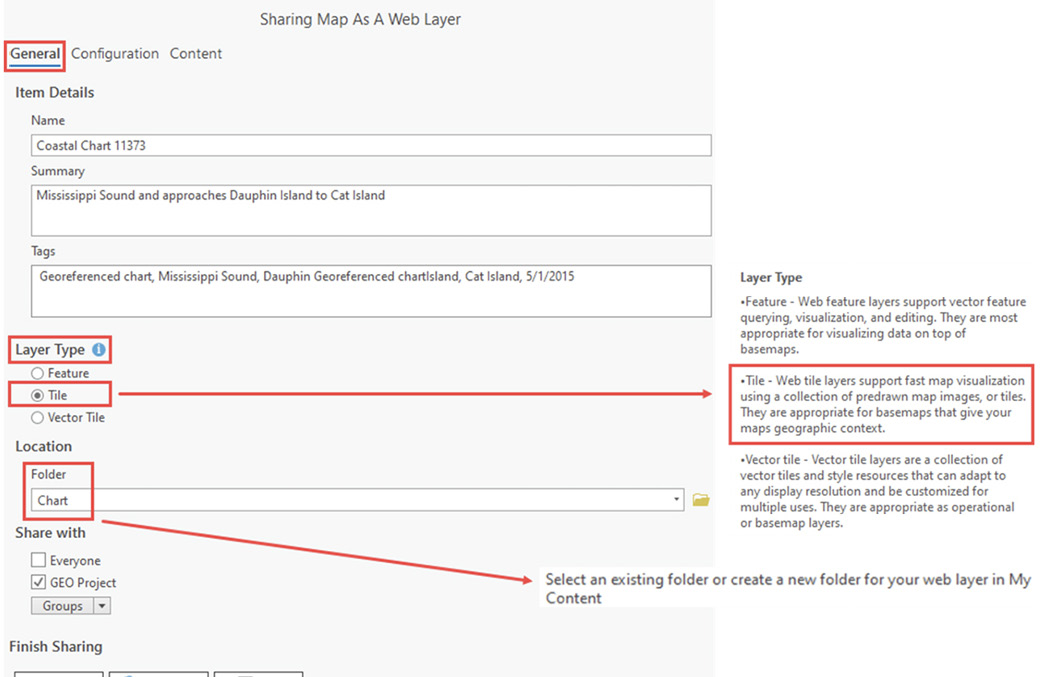
Start by filling out the General tab information. Provide a name for your web layer, a short summary, tags, a folder location where your web layer will be saved, and the sharing options. You can use information as shown in the figure below or modify these settings according to your preferences. The most important option on this panel is the Layer Type. By default, the first option, Feature, is selected, but this particular setting is inappropriate for a raster layer and needs to be changed. From the three available options, make sure to select the second option, Tile. Also, note that in your case, the Share with options will most likely be different from the choices shown in the figure below and will reflect your organizational account settings. The choice to share the web tile layer with Everyone is standard and available to all users. Be cautious when using it, because it allows you to share your web tile layer with the public. This means your published layer will no longer be private and can be accessed by anyone.
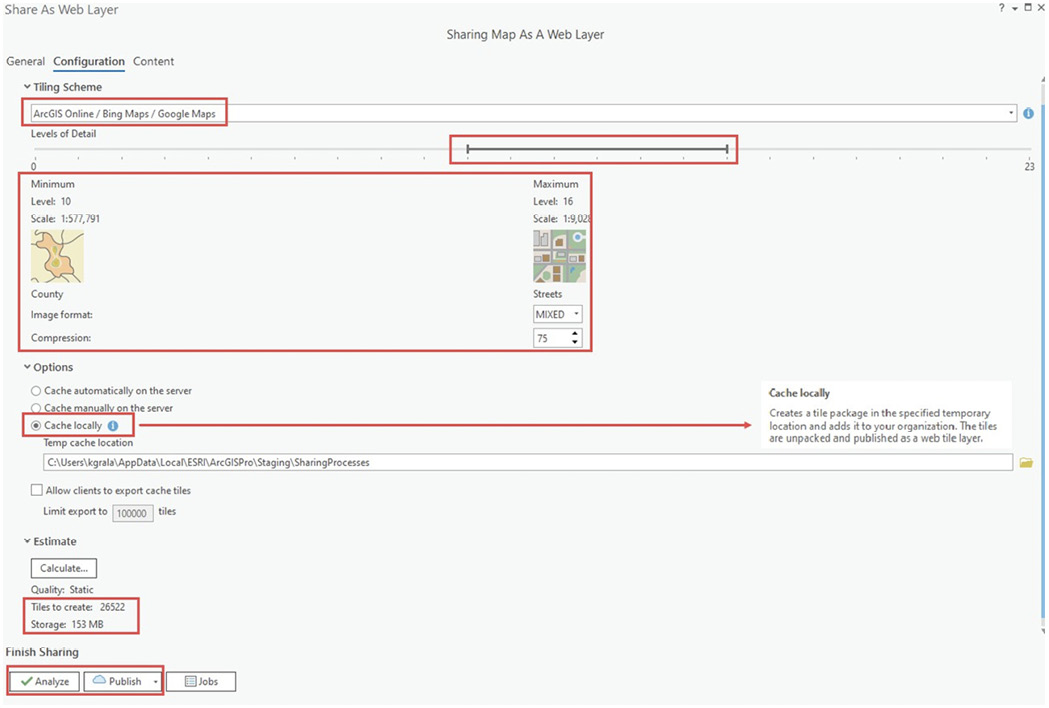
Next, click on the Configuration tab. Review available Tiling Schemes and select ArcGIS Online / Bing Maps / Google Maps option. Test a few different Level of Detail settings. When changing the range of minimum and maximum levels, the number of created tiles and file storage size is automatically estimated. This is an important step; otherwise, your shared web layer may appear blurry. For the nautical chart, setting the Maximum Level to Streets should be adequate. Selecting a larger number of levels for a raster layer significantly increases both the size and processing time. Select Cache locally to save processing credits and also a lot of time. Click Analyze and, if needed, correct errors. It is a good practice to review the warning messages, as well. In this instance, you can ignore the displayed warning message, because it refers to the unsupported topographic basemap. The basemap layer will simply be excluded from the generated web layer. After that, you are ready to Publish this raster chart as a tile web layer.
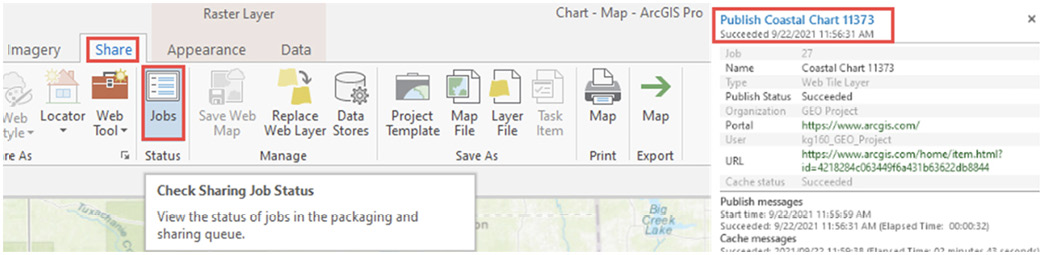
It may take a few minutes for the tile layer to be generated. After the process completes, ArcGIS Pro will notify you that the layer was successfully published. Also, you have an option to review the Job Status pane for detailed information. Close the ArcGIS Pro without saving the project (File > Exit).
Step 4. Display generated tile layer in ArcGIS Online Map Viewer
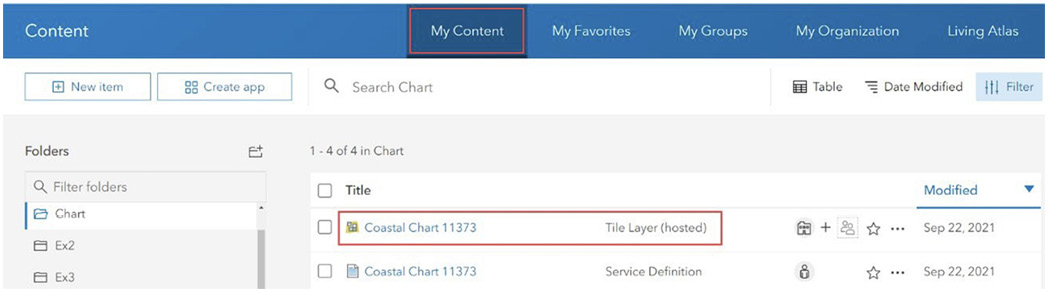
Sign in to your ArcGIS Online account, and open the My Content panel and the folder where you saved the web layer. Your published nautical chart raster will be listed as a Tile Layer (hosted).
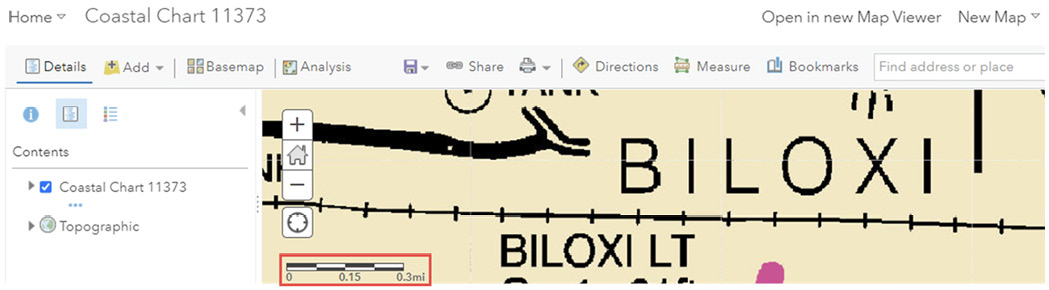
By clicking on the layer name, you get access to a panel where you can change sharing options, edit layer description, add to favorites, and insert into an online map or an application. These settings are optional but should not be overlooked, especially if you intend to share your work with others. After adding the tile layer to an online map, make sure to check if the quality of the display meets your requirements. If not, recreate the tile layer, but this time increase the Level of Detail, accessible under the Configuration panel. The images shown below were generated by assigning two different scales. As you can see, the chart accurately displays detailed information at various zoom levels and does not need to be recreated.

Conclusion
You have published a raster image to ArcGIS Online. Note that in comparison to vector tile layers, the display options for raster tile layers in ArcGIS Online are limited to changing transparency and setting visibility range to a specific scale. In case a particular color scheme is required for your project, you need to change the layer symbology options in ArcGIS Pro before sharing your raster as a web tile layer. If your research group or organization is using a custom basemap gallery, your raster-based tile layer can be added and shared as one of the unique basemaps tailored specifically to your project location and needs.
Geosystems Research Institute
The Geospatial Education and Outreach Project (GEO Project) is a collaborative effort among the Geosystems Research Institute (GRI), the Northern Gulf Institute (a NOAA Cooperative Institute), and the Mississippi State University Extension Service. The purpose of the project is to serve as the primary source for geospatial education and technical information for Mississippi.
The GEO Project provides training and technical assistance in the use, application, and implementation of geographic information systems (GIS), remote sensing, and global positioning systems for the geospatial community of Mississippi. The purpose of the GEO Tutorial series is to support educational project activities and enhance geospatial workshops offered by the GEO Project. Each tutorial provides practical solutions and instructions to solve a particular GIS challenge.
This work was supported through funding by the National Oceanic and Atmospheric Administration Regional Geospatial Modeling Grant, Award # NA19NOS4730207.
The information given here is for educational purposes only. References to commercial products, trade names, or suppliers are made with the understanding that no endorsement is implied and that no discrimination against other products or suppliers is intended.
Publication 3820 (POD-09-22)
By Kate Grala, Northern Gulf Institute; Claire Babineaux, Northern Gulf Institute; and John Cartwright, PhD, Assistant Extension Professor, Geosystems Research Institute.

The Mississippi State University Extension Service is working to ensure all web content is accessible to all users. If you need assistance accessing any of our content, please email the webteam or call 662-325-2262.