
Vol. 13, No. 3 / The U.S. Catfish Aquaculture Industry Remained Stable During the Past Decade
Abstract
- This newsletter shows the over-all trends in U.S. catfish aquaculture production and farmgate values.
- U.S. catfish aquaculture data are available from 1980 to 2022.
- Values beyond 2022 are predicted using econometric models developed by Dr. Posadas.
- A scatter diagram shows the relationship between U.S. catfish aquaculture production and deflated farmgate prices.
- There is a significant inverse relationship between deflated farmgate price and domestic catfish aquaculture production.
- Higher unemployment rates tend to reduce domestic catfish aquaculture production.
- Recessions tend to discourage domestic catfish aquaculture production.
- The global pandemic seemed to encourage higher domestic catfish aquaculture production.
- The US-China trade war tends to adversely affect domestic catfish aquaculture production.
- Natural disasters affecting the Gulf of Mexico states seemed to encourage more domestic catfish aquaculture production.
Acknowledgement
This virtual presentation is a contribution of the Mississippi Agricultural and Forestry Experiment Station and the Mississippi State University Extension Service. This material is based upon work that is supported in part by the National Institute of Food and Agriculture, U.S. Department of Agriculture, Hatch project under accession number 081730 and NOAA (Office of Sea Grant, U.S. Dept. of Commerce, under Grant NA22OAR4170090, Mississippi Alabama Sea Grant Consortium).
Let Us Start Our Modeling Effort!
- The NOAA Fisheries and USDA Quick Facts data on catfish aquaculture production are reported in pounds and dollars per year, respectively.
- U.S. catfish aquaculture data are available from 1980 to 2022.
- Catfish farmgate prices are reported in dollars per pound.
- Values beyond 2022 are predicted using econometric models developed by Dr. Posadas.
- A scatter diagram shows the relationship between U.S. catfish aquaculture production and deflated farmgate prices.
U.S. Aquaculture Economic Models
- The Ordinary Least Squares (OLS) models of U.S. aquaculture consisted of the following dependent variables:
- Aquaculture production (lb/yr)
- Deflated farmgate value ($/yr)
- The OLS models of U.S. aquaculture were estimated using the robust variance procedure of STATA-16.
- The variation inflation factor was calculated to detect the possible presence of multicollinearity.
- The marginal impacts of disaster events were computed using the margins procedure.
U.S. Aquaculture Production Economic Model
- The OLS model of U.S aquaculture production (lb/yr) assumed that annual production could be explained by the following:
- year
- recession, trade war, pandemic, and Gulf natural disasters (1 or 0)
- unemployment rate and growth in per capita disposable income (%)
- other variables
U.S. Aquaculture Farmgate Values Economic Model
- The OLS model of U.S. aquaculture farmgate values ($/yr) assumed that annual production could be explained by the following:
- year
- aquaculture production (lb/yr)
- deflated farmgate price ($/lb)
- unemployment rate and growth in per capita disposable income (%)
- recession, trade war, pandemic, and Gulf natural disasters (1 or 0)
- other variables
-
U.S. Catfish Aquaculture Producers
- The U.S. Aquaculture Census estimated that catfish farms numbered 695 farms in 2013 and 531 farms in 2018.
- Total sales reached $375.8 M in 2013 and $366.8 M in 2018.
- In number of farms, the top three catfish farming states in 2018 are Mississippi (161 farms), Alabama (96 farms), and Texas (37 farms).
- Annual sales reported during aquaculture census were 1.095 times more than the reported annual sales by USDA Quick facts in 2018 and 1.117 times more in 2013.
U.S. Catfish Aquaculture Production
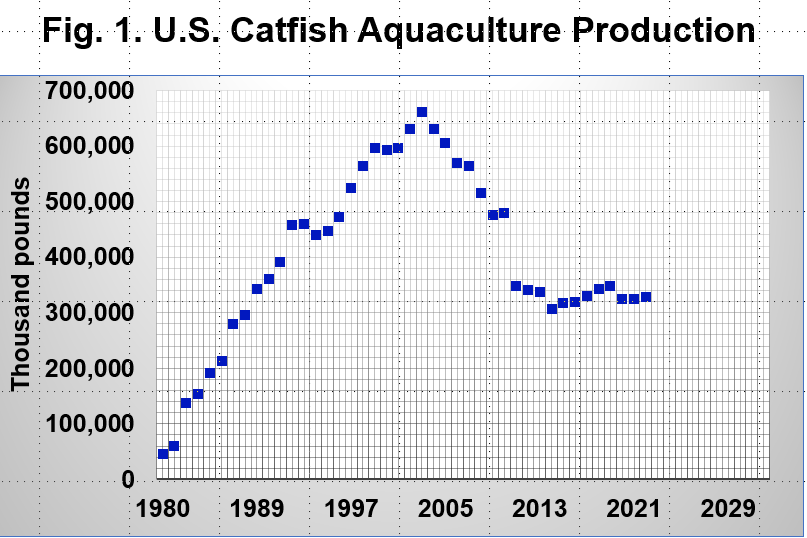
- Annual U.S. aquaculture production since 1980 are shown in Fig. 1.
- The blue dots show annual catfish aquaculture production from 1980 to 2022.
- The U.S. catfish aquaculture production peaked in early 2000. Since then, production declined and remained steady.
U.S. Catfish Aquaculture Farmgate Values
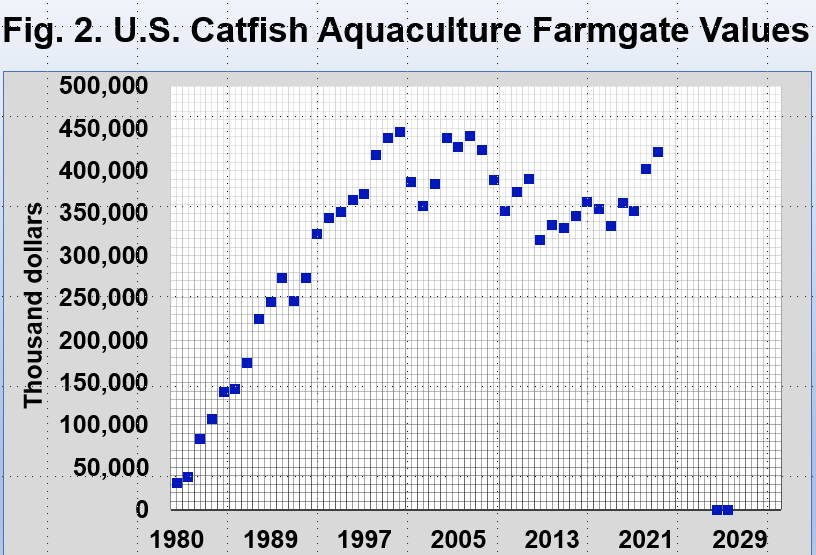
- Annual U.S. catfish aquaculture farmgate values since 1980 are shown in Fig. 2.
- The blue dots show annual catfish farmgate values reported from 1980 to 2022.
- The 2013 and 2018 values, however, are slightly lower than the Aquaculture Census estimates.
U.S. Catfish Aquaculture Farmgate Prices
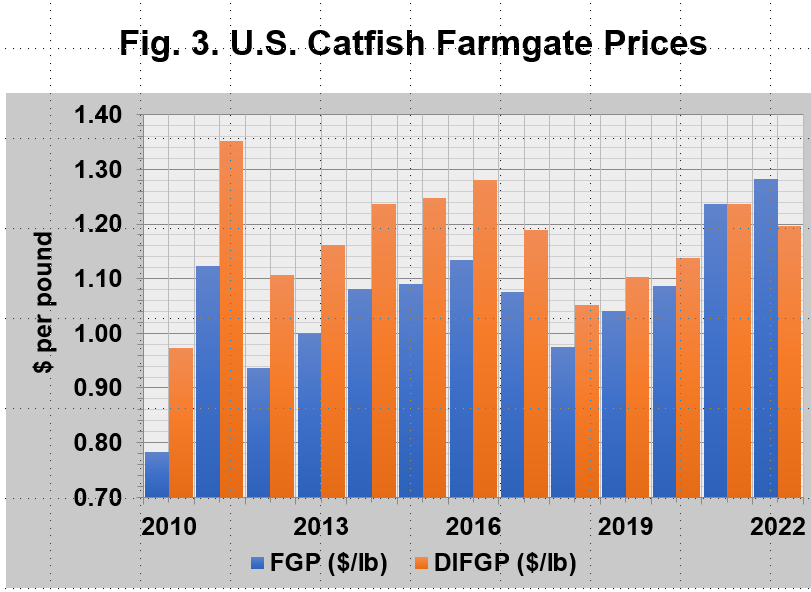
- The annual U.S. catfish farmgate prices from 2010 to 2022 are shown in Fig. 3.
- The blue bars (FGP) show the annual catfish farmgate prices.
- The red bars (DFGP) show the annual catfish deflated farmgate prices.
U.S. Catfish Aquaculture Production and Farmgate Prices
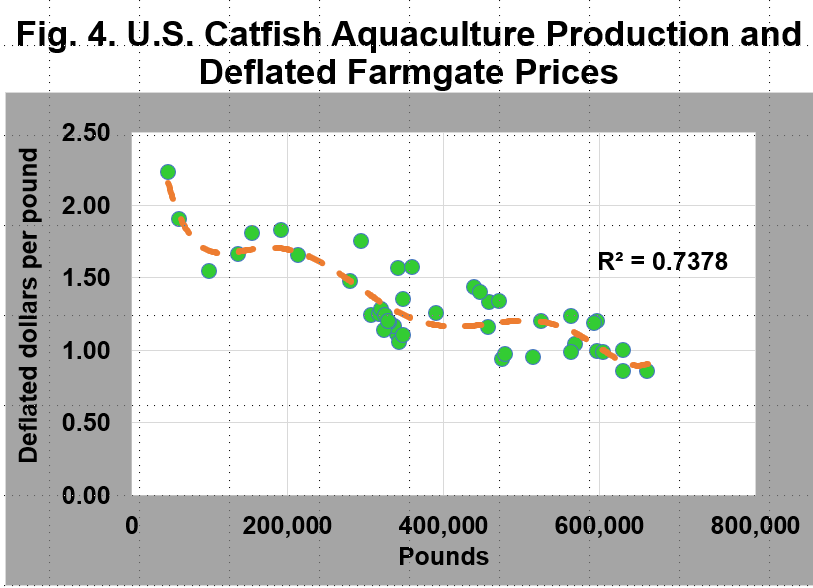
- The scatter diagram between the U.S. catfish aquaculture production and farmgate prices is shown in Fig. 4 with an R-squared = 0.74.
- The green dots are the deflated catfish farmgate prices at various levels of production from 1980 to 2022.
- The orange dotted curve is the Excel-generated polynomial equation of deflated farmgate prices at various levels of catfish production.
- It seems that lower deflated farmgate prices were observed at higher levels of catfish production during the past four decades.
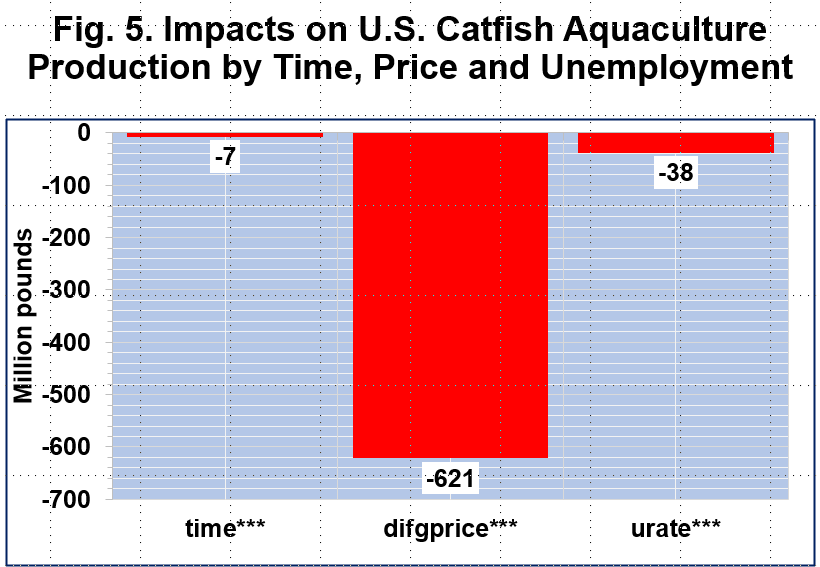
Impacts on U.S. Catfish Aquaculture Production by Time, Price, and Unemployment
- The estimated OLS equation for domestic catfish aquaculture production is statistically significant and have an R-squared = 0.90.
- U.S. catfish aquaculture production generally declined over time (Fig. 5).
- There is a significant inverse relationship between deflated farmgate price and domestic catfish aquaculture production.
- Higher unemployment rates tend to reduce domestic catfish aquaculture production.
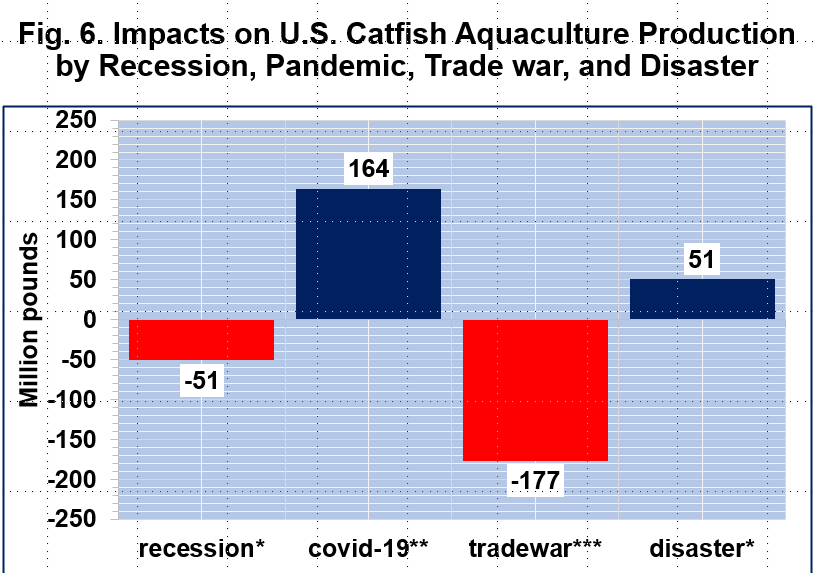
Impacts on U.S. Catfish Aquaculture Production by Recession, Pandemic, Trade War, and Disaster
- Recessions tend to discourage domestic catfish aquaculture production (Fig. 6).
- The global pandemic seemed to encourage higher domestic catfish aquaculture production.
- The US-China trade war tends to adversely affect domestic catfish aquaculture production.
- Natural disasters affecting the Gulf of Mexico states seemed to encourage more domestic catfish aquaculture production.
Impacts on U.S. Catfish Deflated Farmgate Values
- The estimated OLS equation for U.S. catfish deflated farmgate values is statistically significant and have an R-squared = 0.93.
- U.S. deflated catfish farmgate values were not significantly influenced by recessions, pandemic, trade wars and natural disasters.
- Time, deflated farmgate price, and domestic catfish aquaculture production seemed to have significantly enhanced deflated catfish farmgate values.
Impacts on U.S. Catfish Deflated Farmgate Prices
- The estimated OLS equation for U.S. catfish deflated farmgate values is statistically significant and have an R-squared = 0.93.
- Recessions, pandemic, and trade wars tend to have exerted significant negative influences on U.S. deflated catfish farmgate prices.
- Time, domestic catfish production and the unemployment rate also tend to negatively impacted U.S. deflated catfish farmgate prices.
My Catfish Economics Outreach
Posadas, B.C. 2023. The U.S. Catfish Aquaculture Industry Remained Stable During the Past Decade. Mississippi MarketMaker Newsletter, Vol. 13, No. 3. March 14, 2023. http://extension.msstate.edu/newsletters/mississippimarketmaker.
Posadas, B.C. 2023. U.S Catfish Aquaculture Industry. HME Outreach. MSUCREC, Virtual presentation. (March 6). https://youtu.be/8s_tNQG31_g.
Posadas, B.C. 2022. Impacts of the Global Pandemic on Prices of Catfish Products in U.S. Domestic Markets. Mississippi MarketMaker Newsletter, Vol. 12, No. 3. (April 6). https://extension.msstate.edu/newsletters/mississippimarketmaker/2022/vol-12-no3-impacts-the-global-pandemic-prices-catfish-0.
Posadas, B.C. 2022. Price Outlook of U.S. Catfish Products. Mississippi State University, Coastal Research and Extension Center, Virtual Presentation. (April 5). https://youtu.be/zMaCWy8hW3o.
Posadas, B.C. 2020. U.S. Catfish Production, Farm-gate and Wholesale Prices, and Imports. Mississippi MarketMaker Newsletter, Vol. 10, No. 8. (August 28). http://extension.msstate.edu/newsletters/mississippi-marketmaker/2020/vol-10-no-8-us-catfish-production-and-imports-farm-gate-and.
Posadas, B.C. 2017. Commercial Catfish Production in the United States. Mississippi MarketMaker Newsletter, Vol. 7, No. 12. (August 28). http://extension.msstate.edu/newsletters/mississippi-marketmaker/2017/vol-7-no-12-commercial-catfish-production-the-united-states.


