
Vol. 15, No. 5 / Direct Revenue Impacts of Tariffs on U.S. Shrimp Imports
May 20, 2025
ABSTRACT
This newsletter describes the meaning of revenue impacts of tariffs and types of U.S. shrimp imports. It shows the long-term annual U.S. shrimp imports and the top 5 sources of U.S. shrimp imports. It also summarizes the calculated duties on shrimp imports. A comparison of the U.S. shrimp imports from China, India, and Ecuador shows the differences in trends between a high tariff to a low tarrif and no tariff shrimp imports. Attempts are made to estimate the expected revenue impacts of tariffs in 2025.
KEYWORDS
- Shrimp imports, calculated duties, and major shrimp exporters
REVENUE IMPACTS
- The direct revenue impacts of U.S. shrimp imports are the sum of the calculated duties imposed on imported shrimp products.
- Source of raw data: NOAA Fisheries.
TYPES OF SHRIMP IMPORTS
- Fresh shrimp imports
- Shrimp warm water shell-on fresh
- Shrimp warm water peeled fresh
- Shrimp cold-water shell-on fresh
- Source of raw data: NOAA Fisheries.
- Frozen shrimp products
- Shrimp warm water peeled frozen farmed
- Shrimp warm water shell-on frozen farmed
- Shrimp warm water shell-on frozen wild
- Shrimp cold-water shell-on frozen
- Source of raw data: NOAA Fisheries.
- Processed shrimp imports
- Shrimp canned
- Shrimp breaded frozen
- Shrimp shell-on dried/salted/brine
- Shrimp products prepared dinners
- Shrimp other preparations
- Source of raw data: NOAA Fisheries.
U.S. SHRIMP IMPORTS, 1998-2024
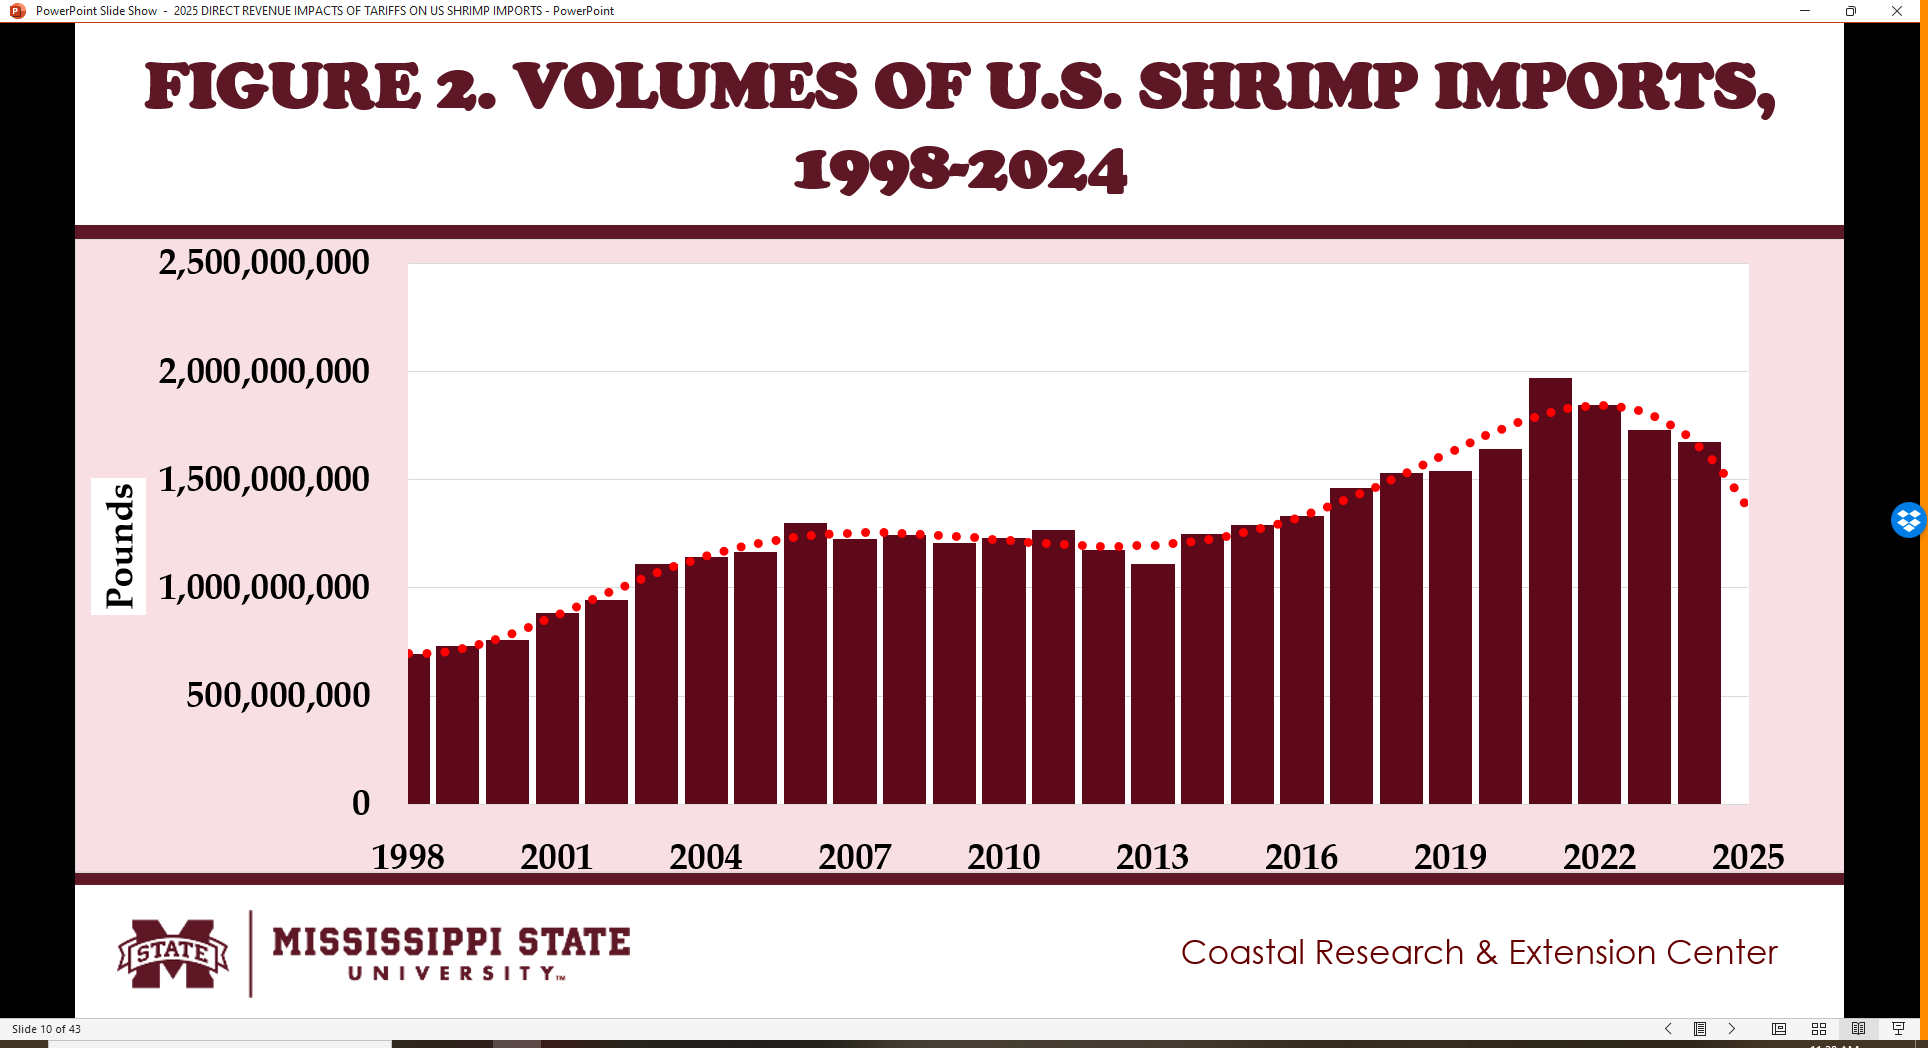
- Fig. 1 and 2 show the value and volume of U.S. shrimp imports from 1998 to 2024.
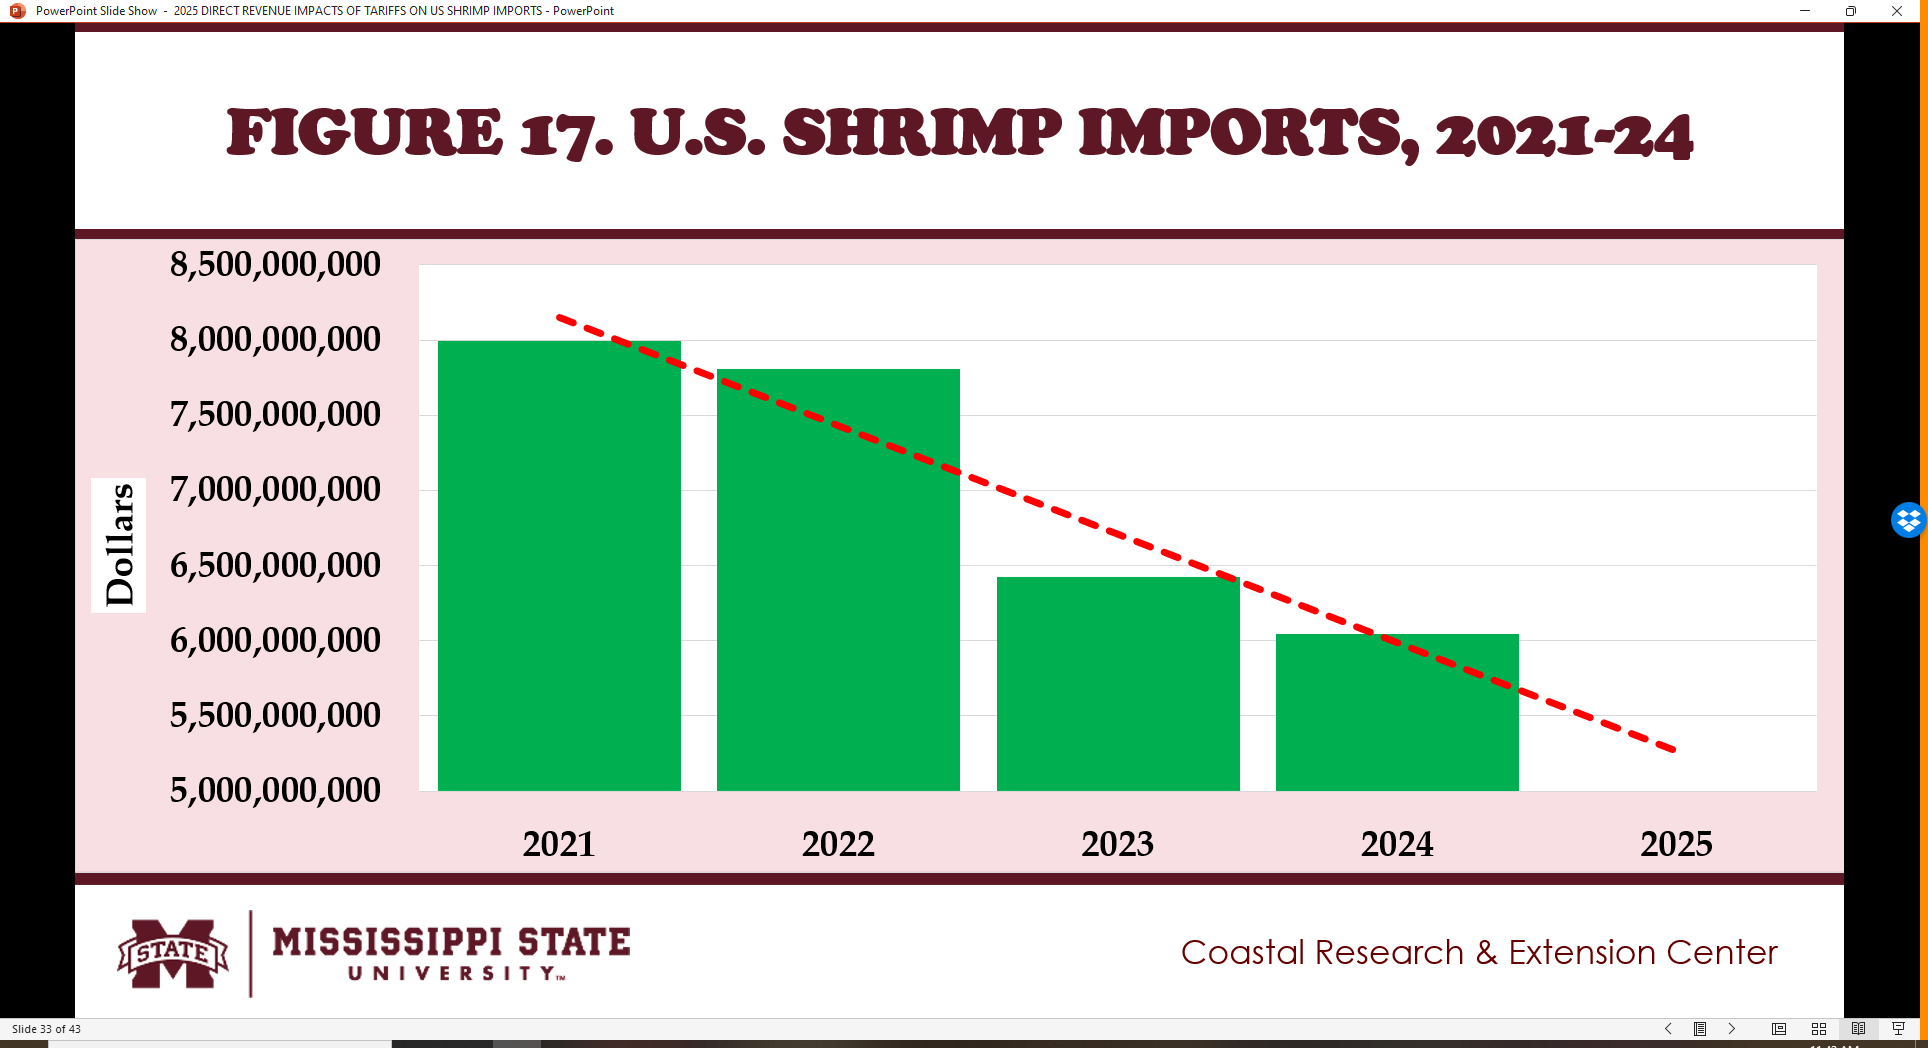
- The volume and value of U.S. shrimp imports peaked in 2021 at 1.97 billion pounds valued at $7.99 billion.
- After 2021, the volume and value started declining reaching 1.67 billion pounds valued at $6.04 billion in 2024.

TOP FIVE SOURCES OF U.S. SHRIMP IMPORTS IN 2024
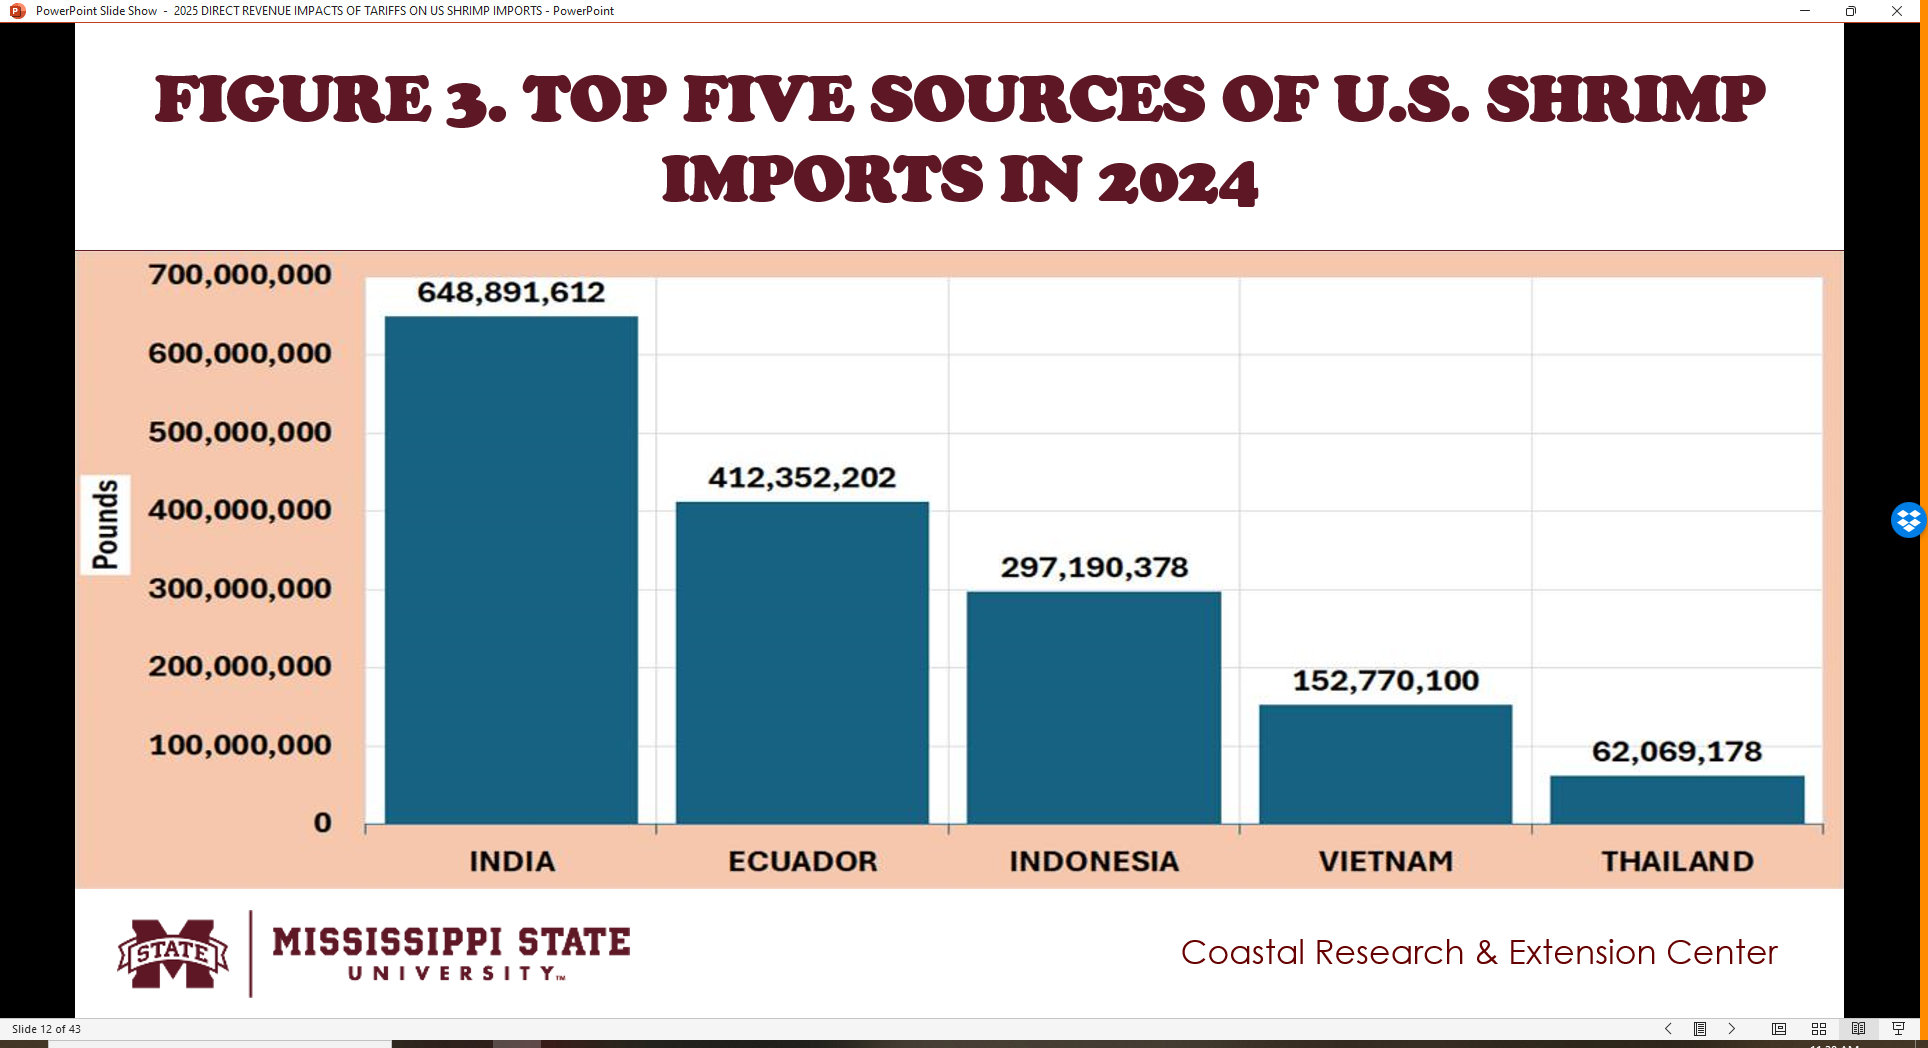
- Fig. 3 and 4 show the volume and value of the top five sources of U.S. shrimp imports in 2024.
- India topped the list exporting shrimp to the U.S. amounting to 648.89 million pounds valued at $2.24 billion in 2024.
- Ecuador is second in the list exporting shrimp to the U.S. reaching to 412.35 million pounds valued at $1.28 billion in 2024.
- The third to fifth exporters of shrimp to the U.S. are Indonesia, Vietnam, and Thailand.
- The sixth to tenth exporters of shrimp values to the U.S. are Argentina, Mexico, Canada, Peru, and China.
- The sixth to tenth exporters of shrimp volumes to the U.S. are Argentina, Mexico, China, Saudi Arabia, and Peru.

CALCULATED DUTIES ON U.S. SHRIMP IMPORTS
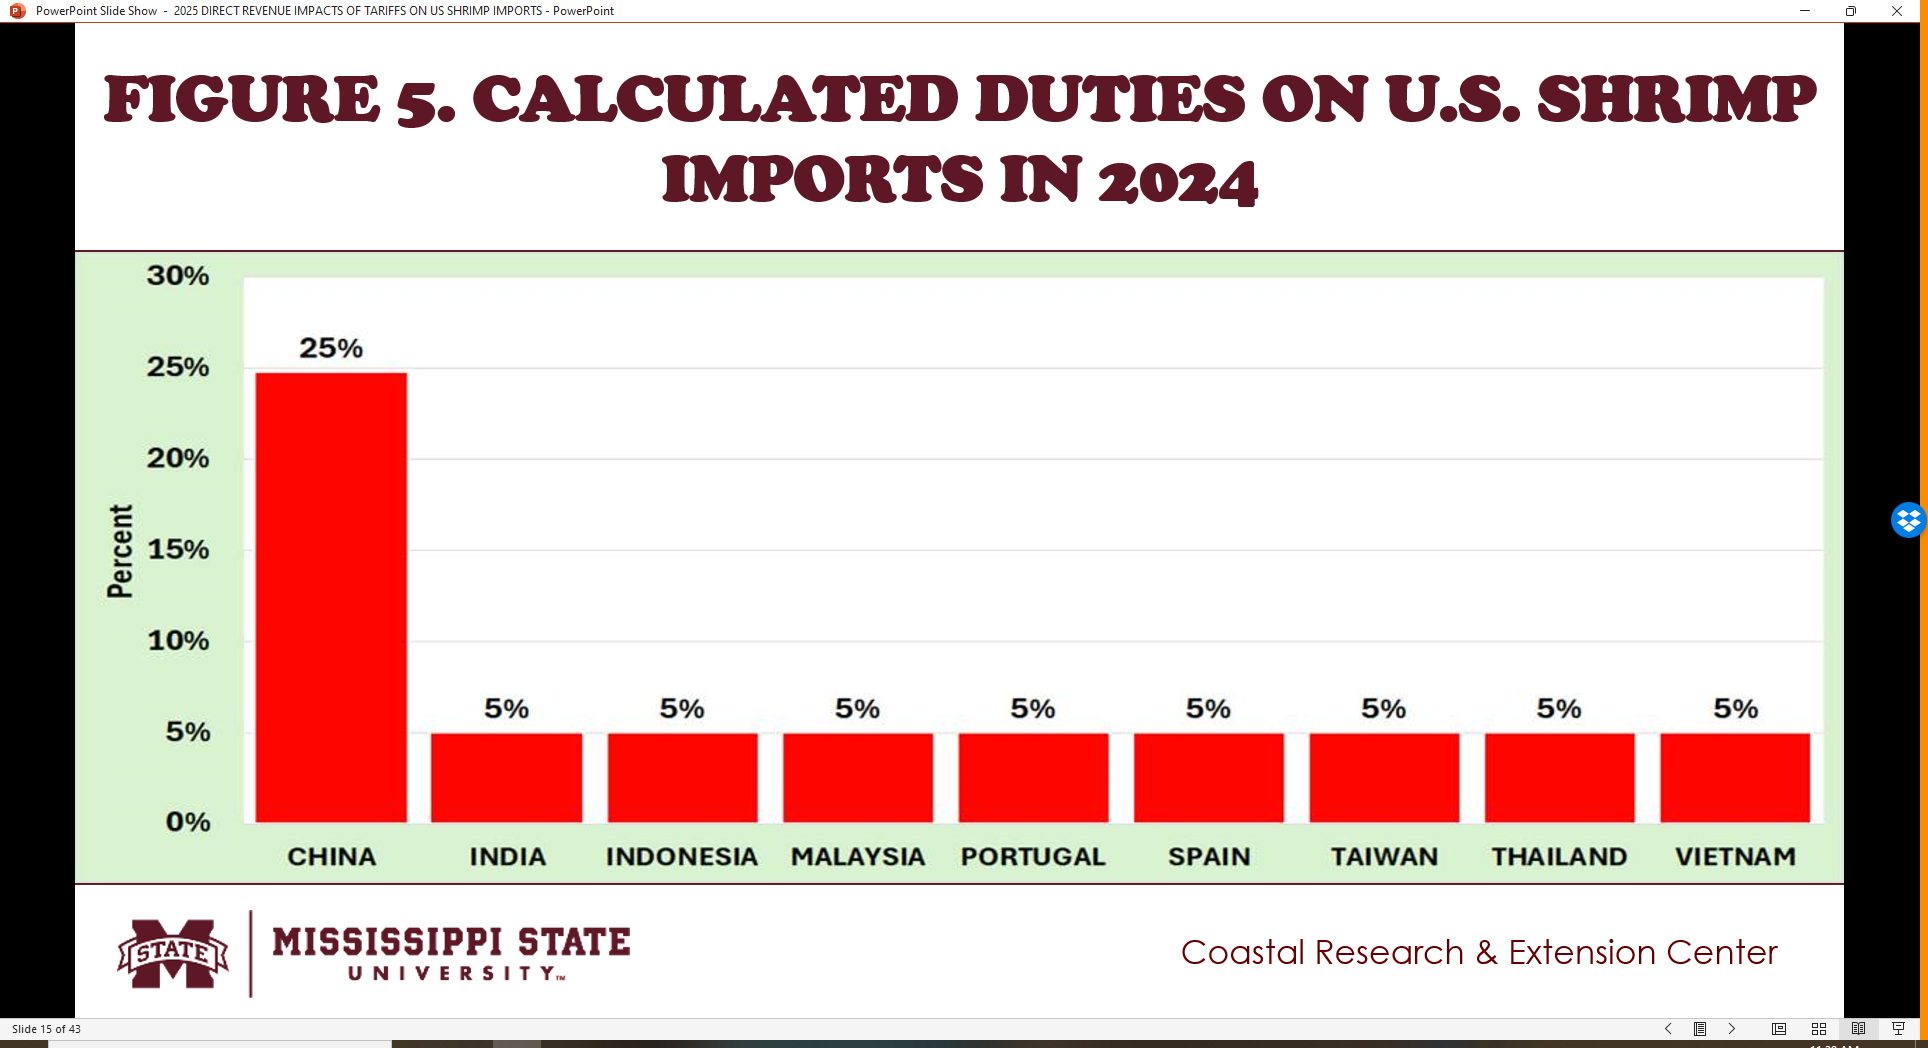
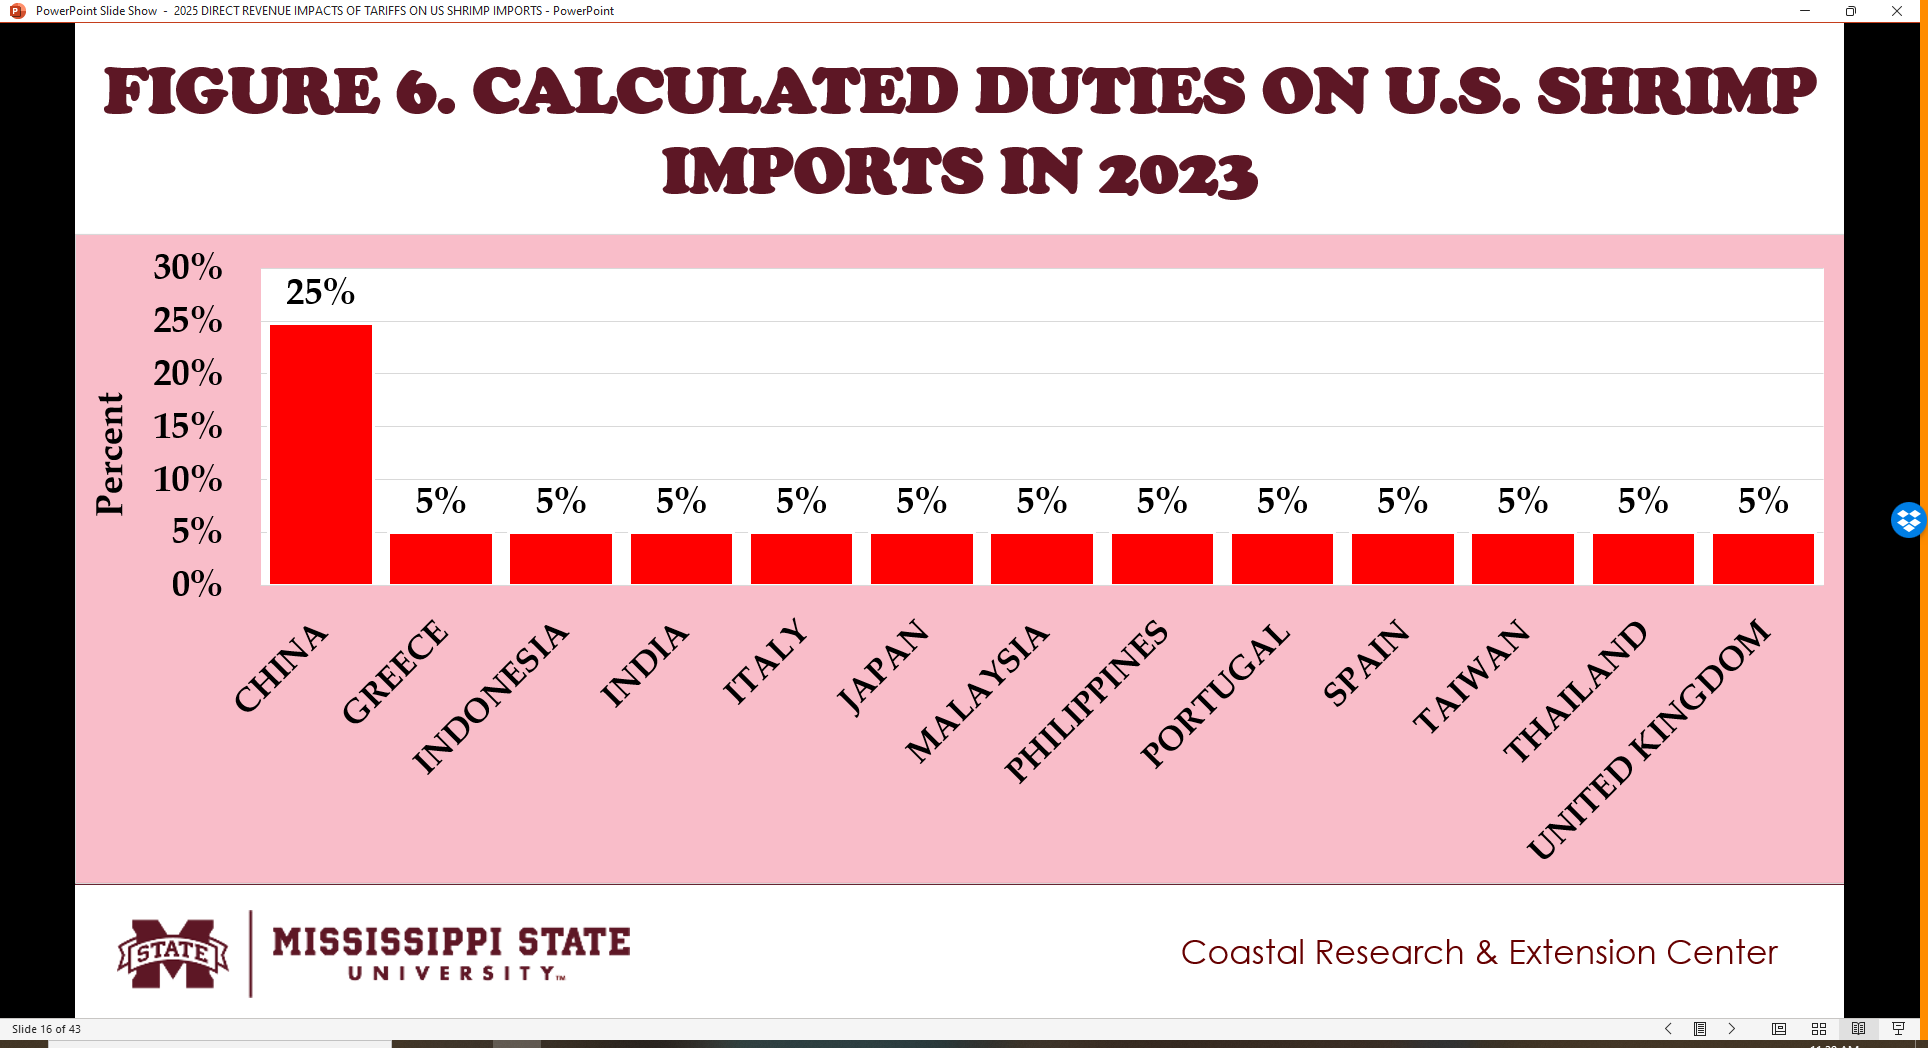
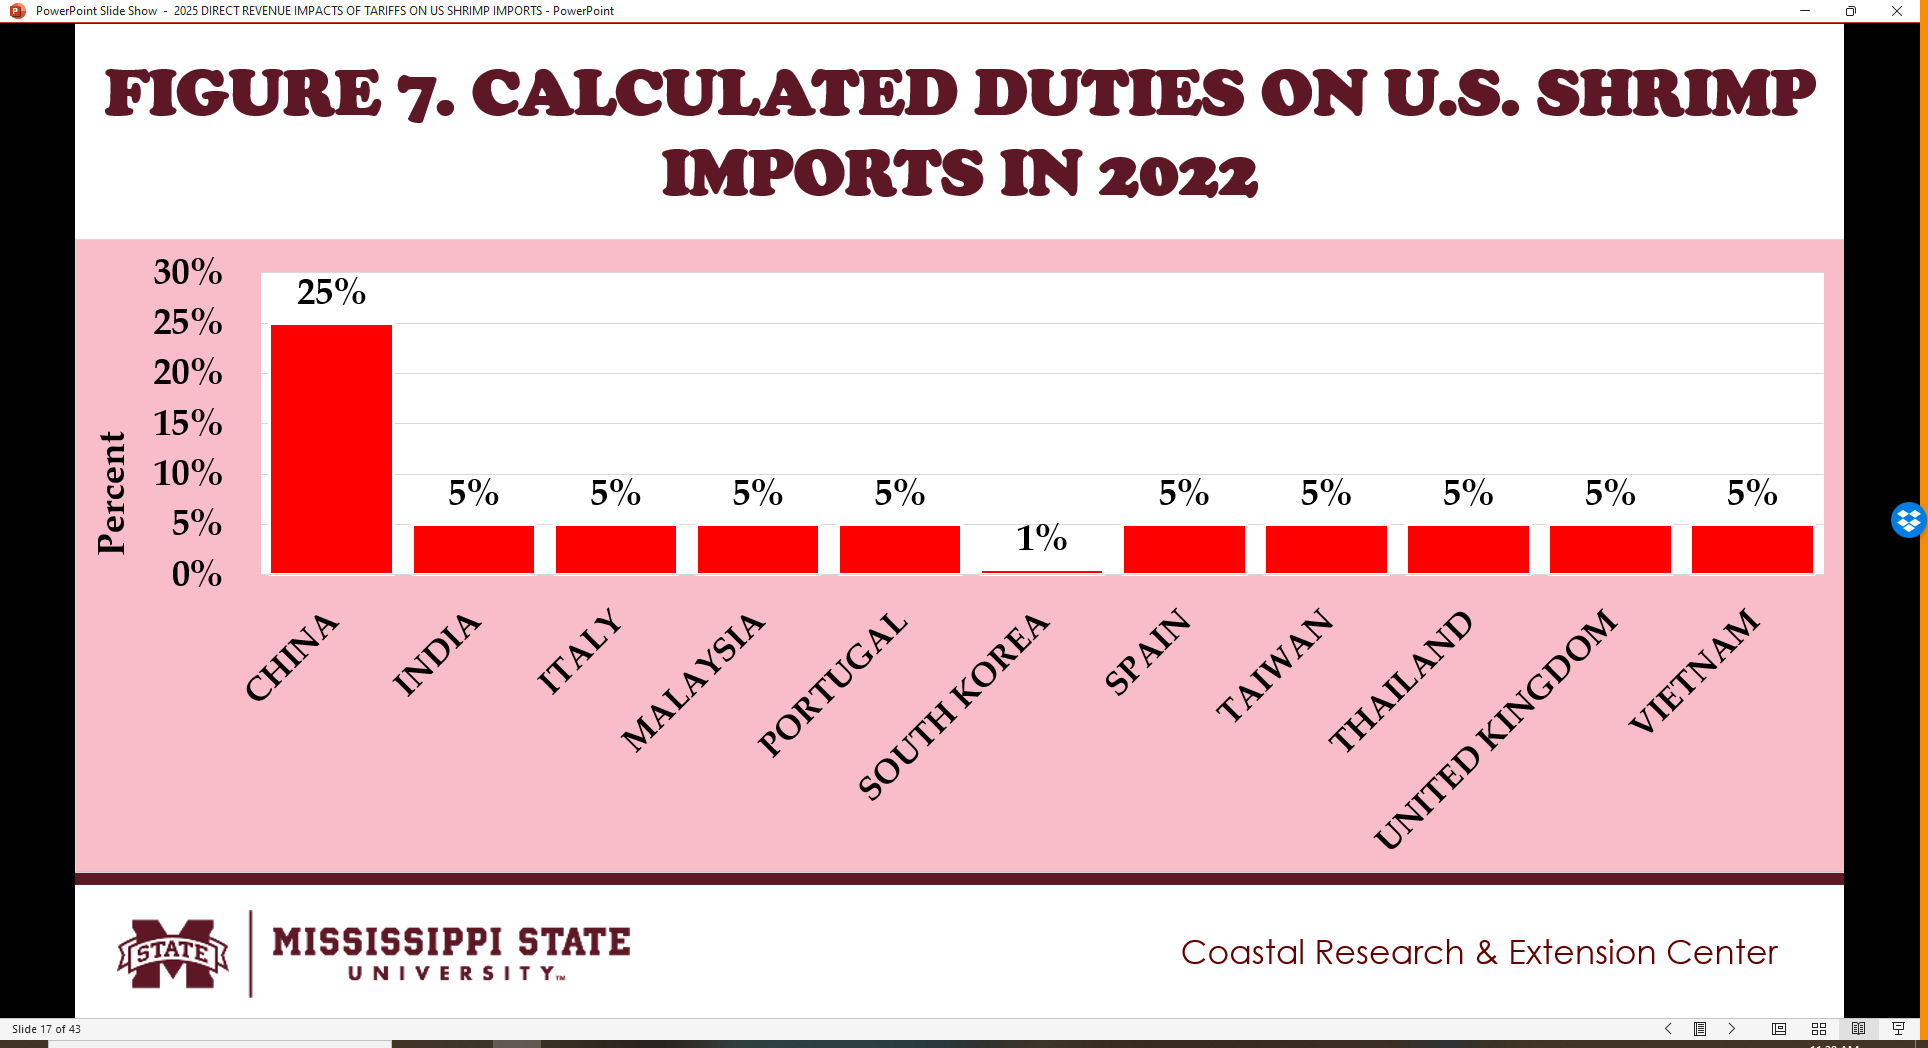
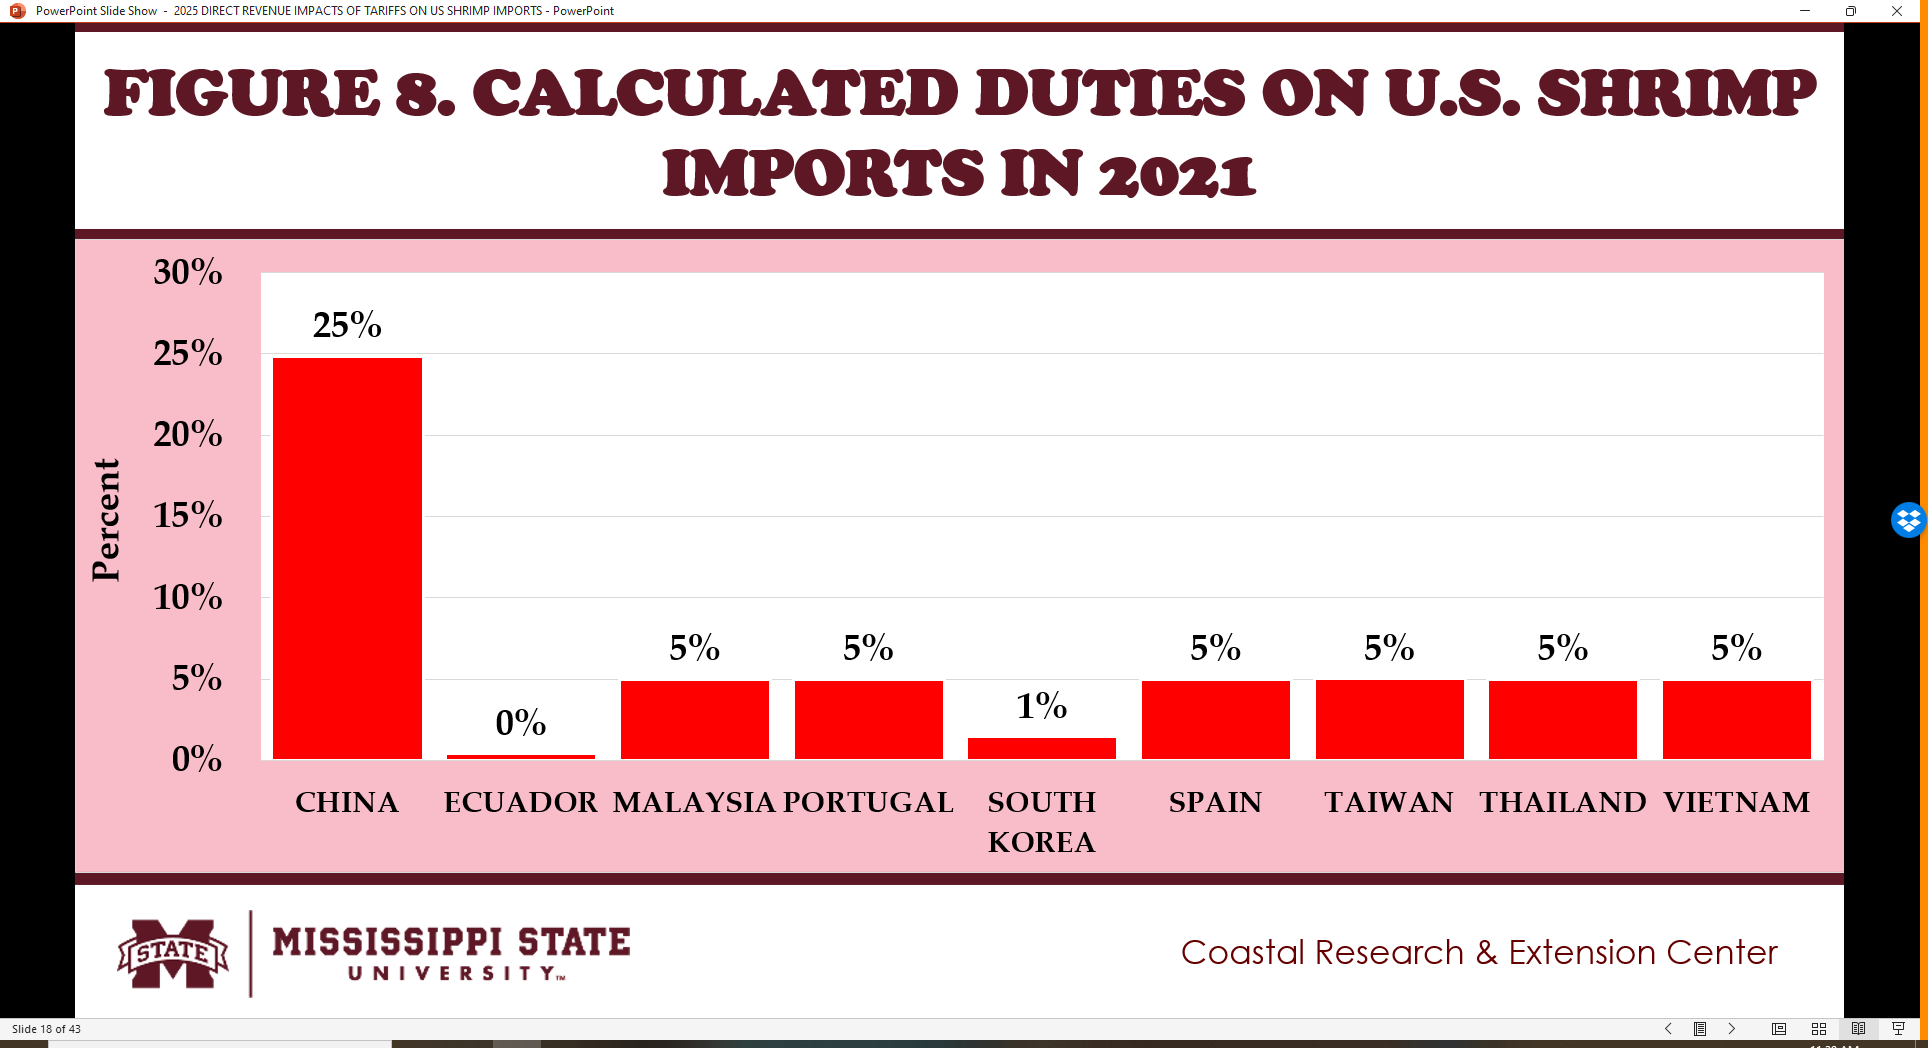
- Fig. 5 to 8 show the annualized calculated duties on U.S. shrimp imports from 2021 to 2024 by exporting country.
- China topped the list with calculated duties amounting to 25 percent from 2018 to 2024.
- In 2024, calculated duties of five percent were imposed on imports from India, Indonesia, Japan, Malaysia, Portugal, Spain, Taiwan, Thailand, and Vietnam.
- In 2023, calculated duties of five percent were imposed on imports from Greece, India, Indonesia, Italy, Japan, Malaysia, Philippines, Portugal, Spain, Taiwan, Thailand, and United Kingdom.
- In 2022, calculated duties of five percent were imposed on imports from India,, Italy, Malaysia, Portugal, South Korea, Spain, Taiwan, Thailand, United Kingdom, and Vietnam.
- In 2021, calculated duties of five percent were imposed on imports from Malaysia, Portugal, Spain, Taiwan, Thailand and Vietnam. Less than one percent calculated duties were imposed on imports from South Korea and Ecuador.
AVERAGE RATES OF DUTIES ON U.S. SHRIMP IMPORTS, 2016-24
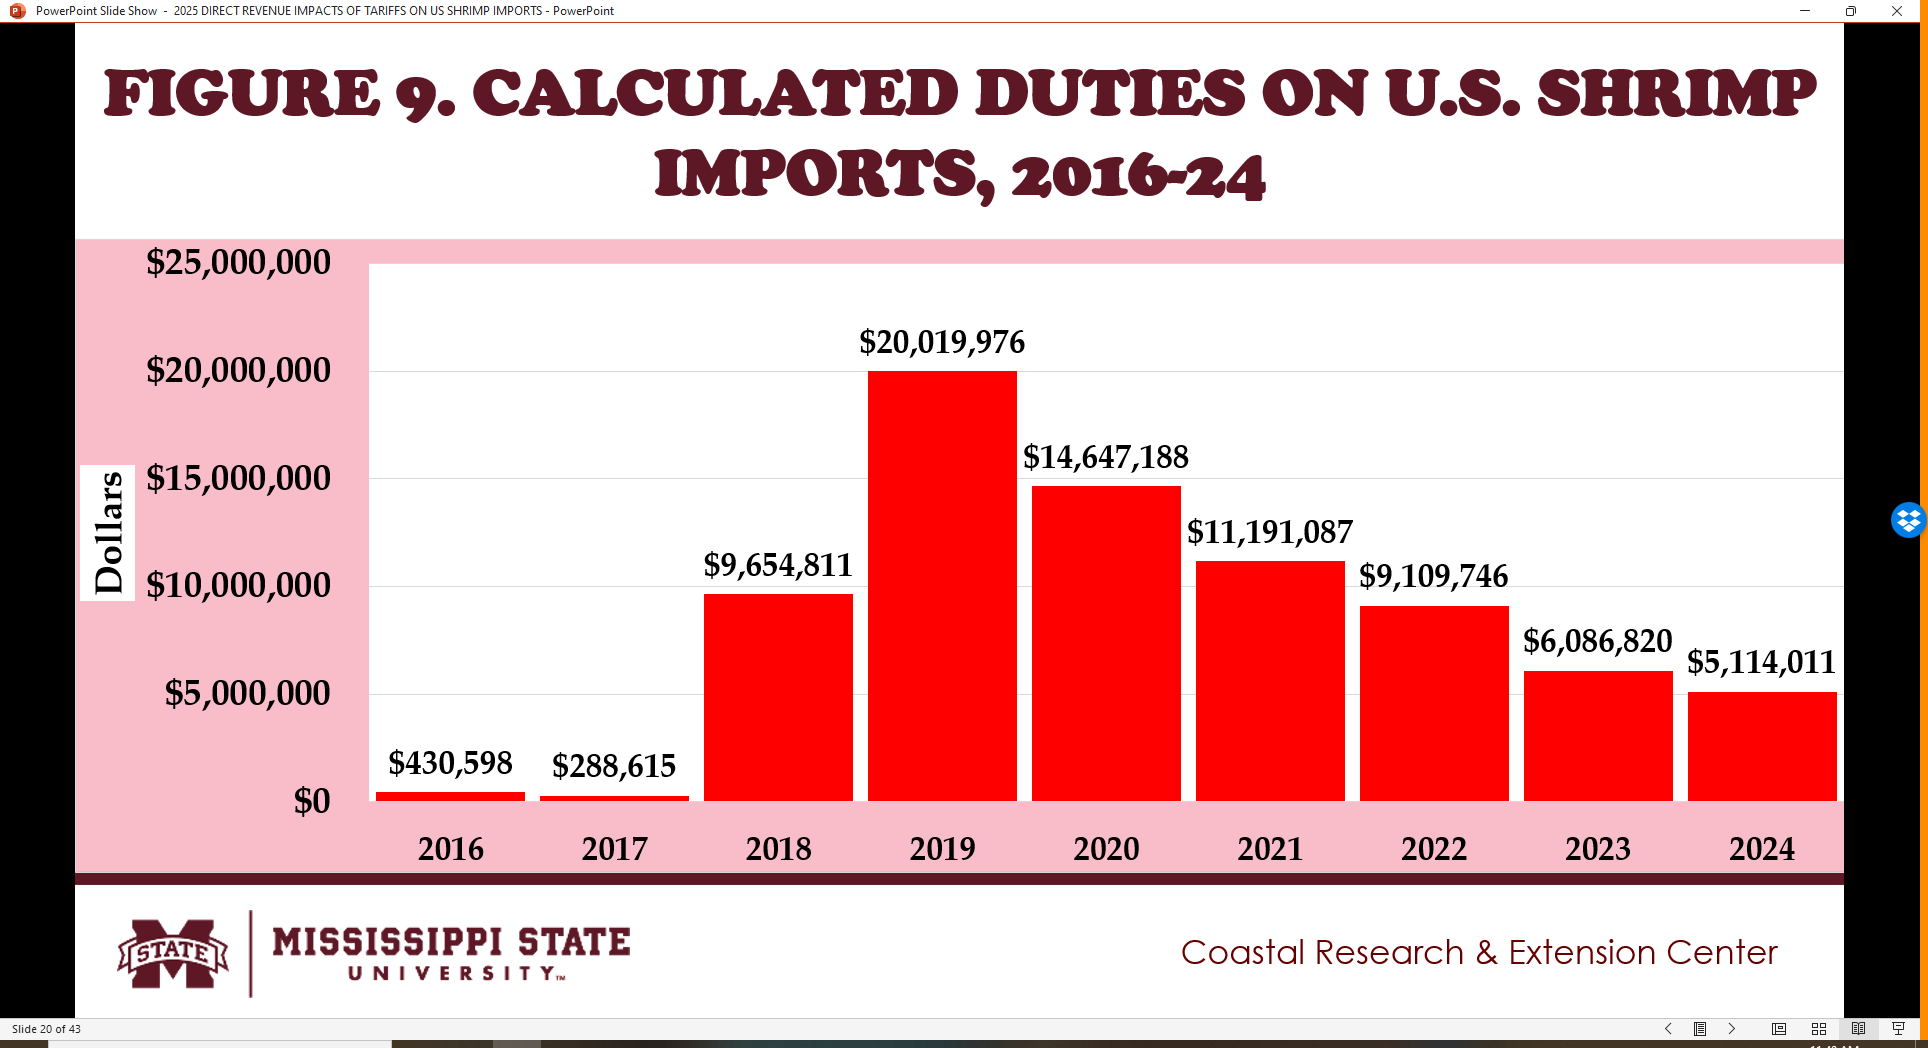
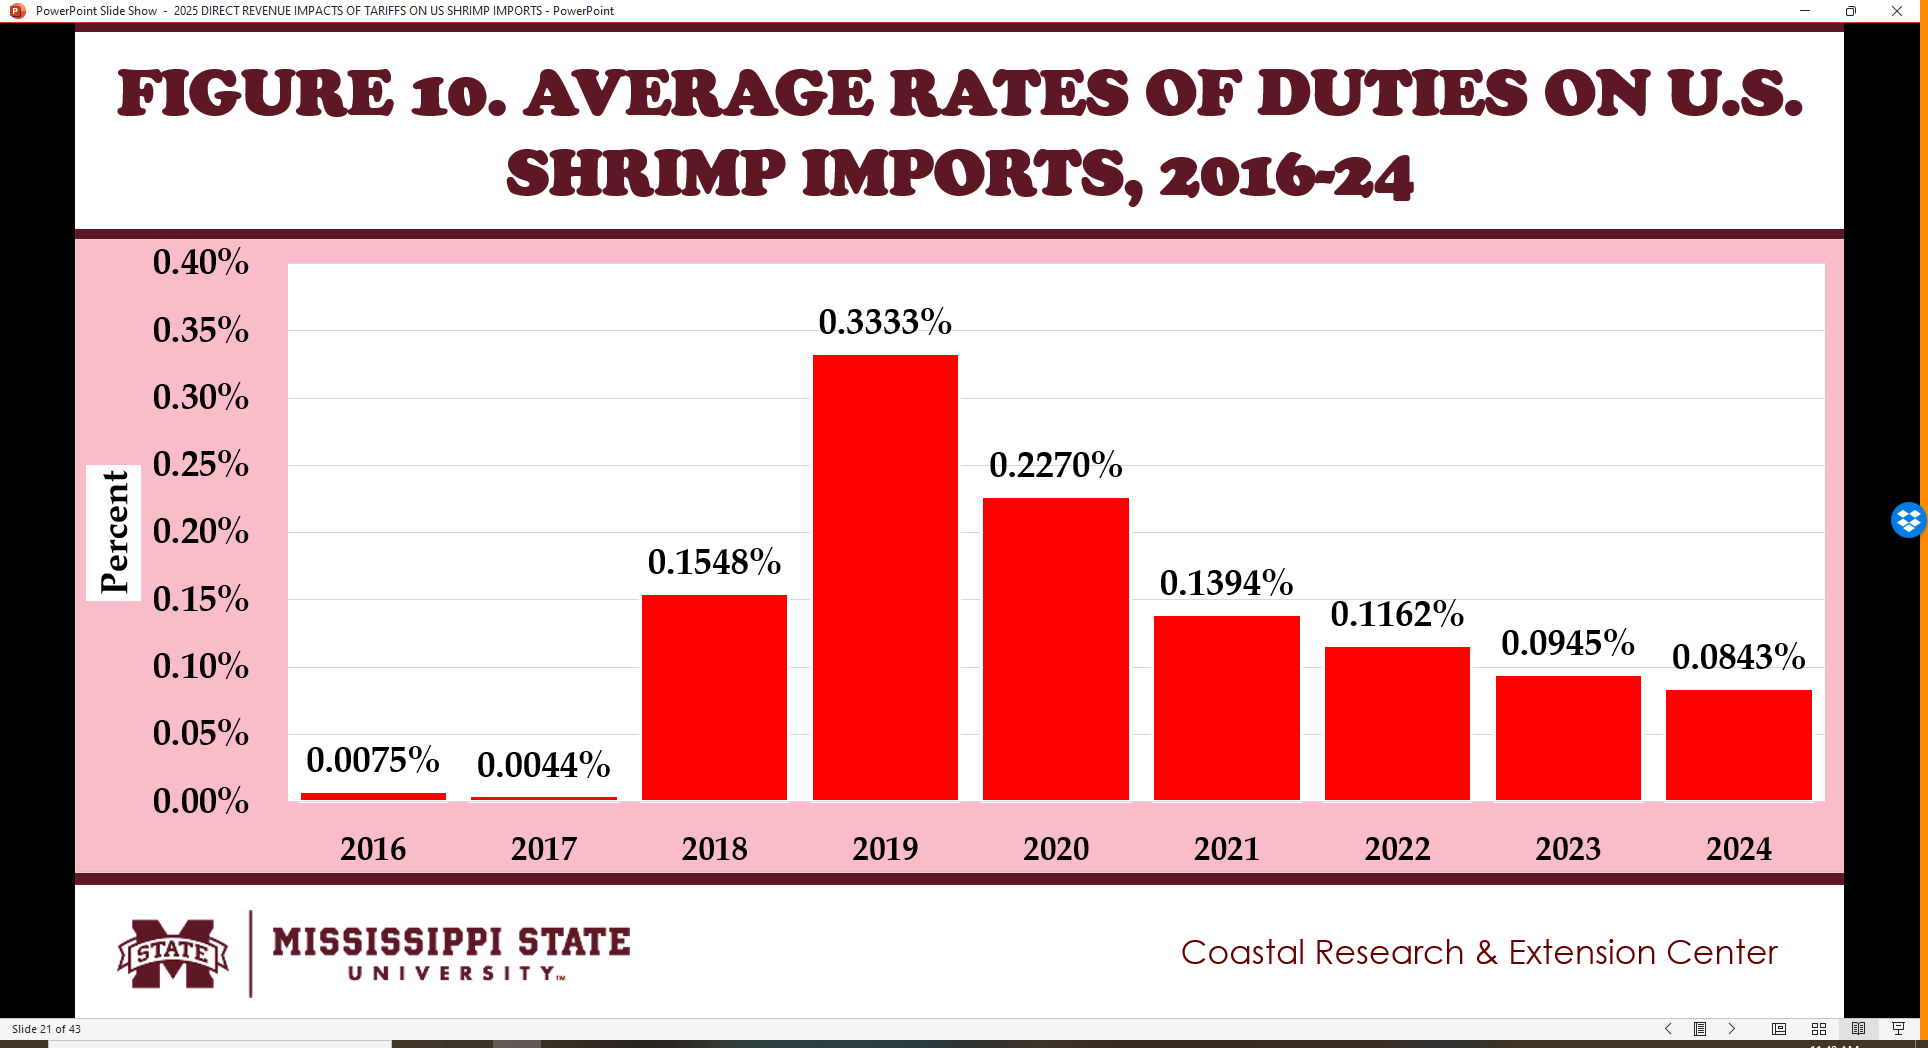
- Fig. 9 to 10 show the annualized calculated duties on U.S. shrimp imports from 2016 to 2024.
- Significant annual revenues from tariffs imposed on shrimp imports started in 2018 when the US-China trade war started.
- In 2018, the average tariff rate calculated on all shrimp imports averaged 0.1548 percent.
- The peak of tariff revenues imposed on shrimp imports was in 2019 amounting to $20.01 million at an average rate of 0.3333 percent.
- Since 2020, the total revenues and average rates of calculated duties started to decline to $5.11 million at an average rate of 0.0843 percent in 2024.
COMPARATIVE U.S. SHRIMP IMPORTS FROM CHINA, ECUADOR AND INDIA
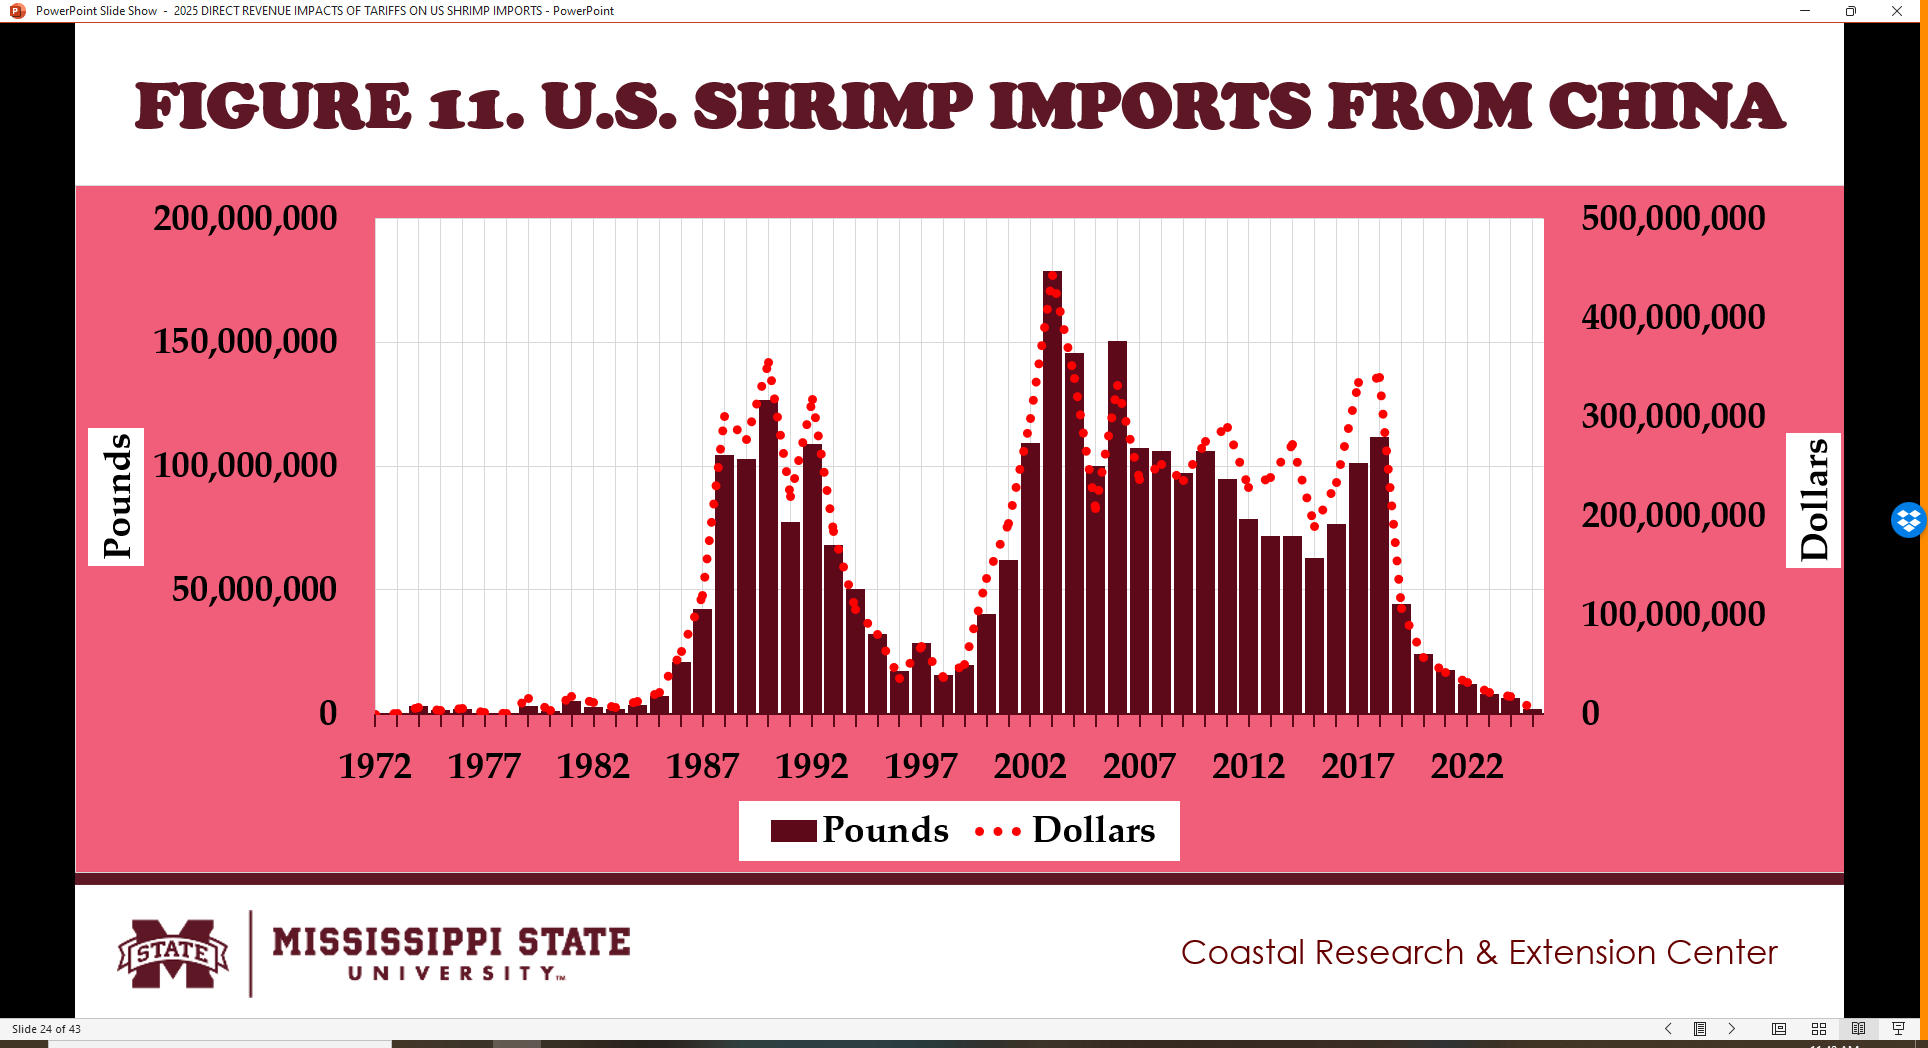
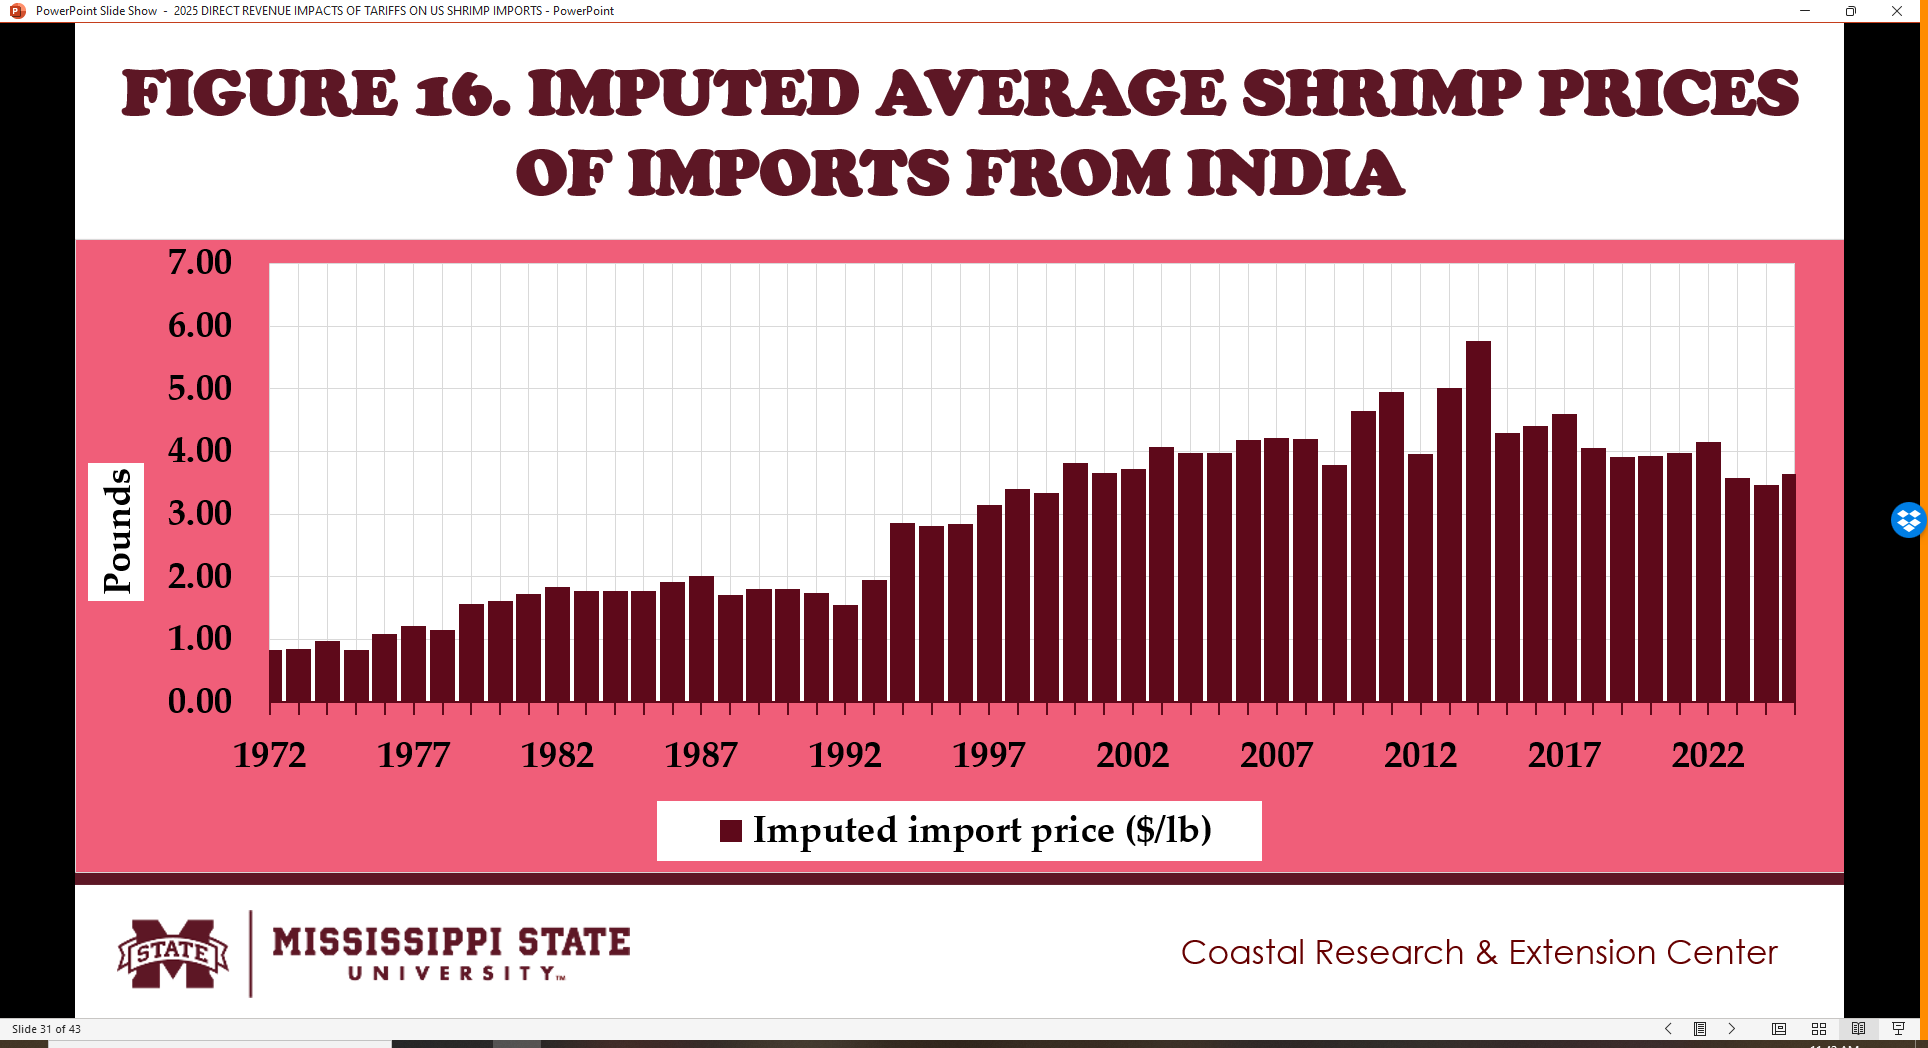
- Fig. 11 to 16 show the long-term trends in annual shrimp imports from 1972 to 2024 from three major shrimp exporters to the U.S.
- First is China which has an ongoing trade war with the U.S. since 2018 and has been subjected to 25 percent tariff on all shrimp imports.
- Total shrimp imports from China significantly fall when the US-China trade war started in July 2018 (Fig. 11).
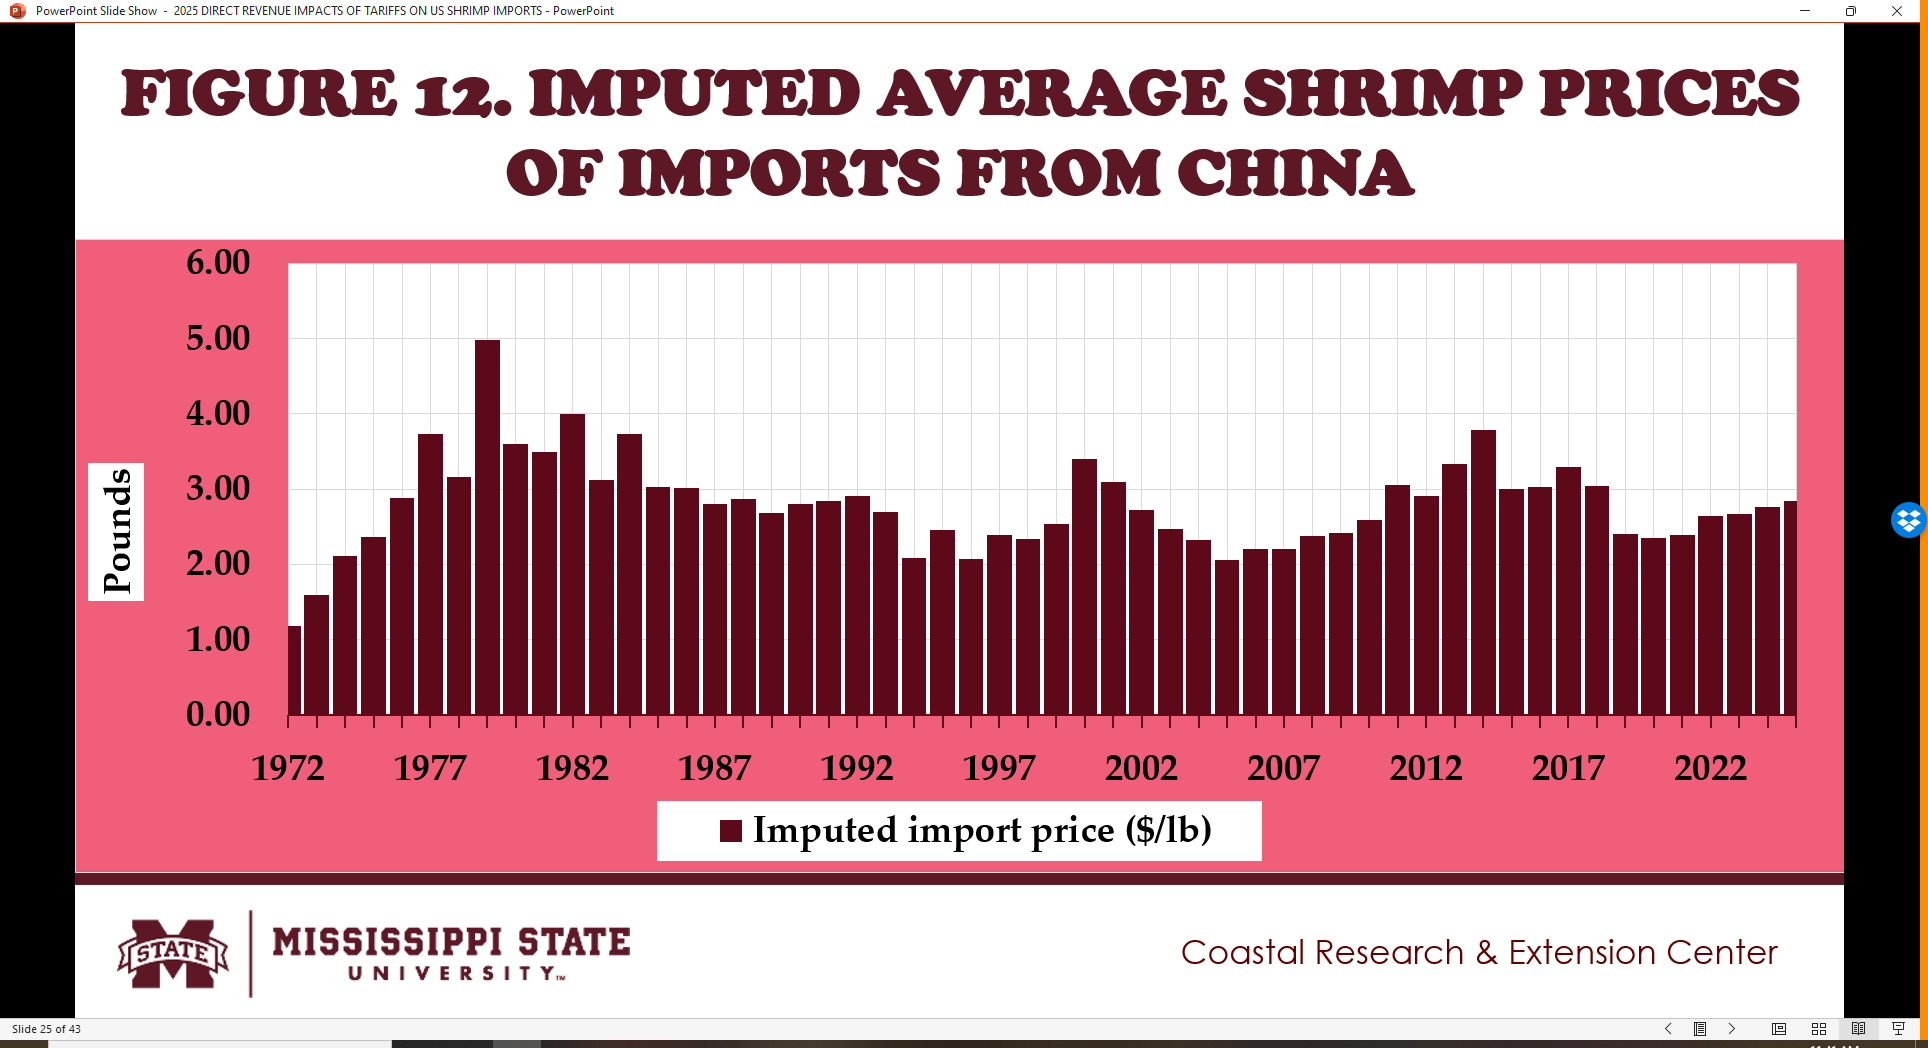
- The imputed average price of shrimp imports from China fell and remained below $3.00 per pound since 2018.
COMPARATIVE U.S. SHRIMP IMPORTS FROM CHINA, ECUADOR AND INDIA
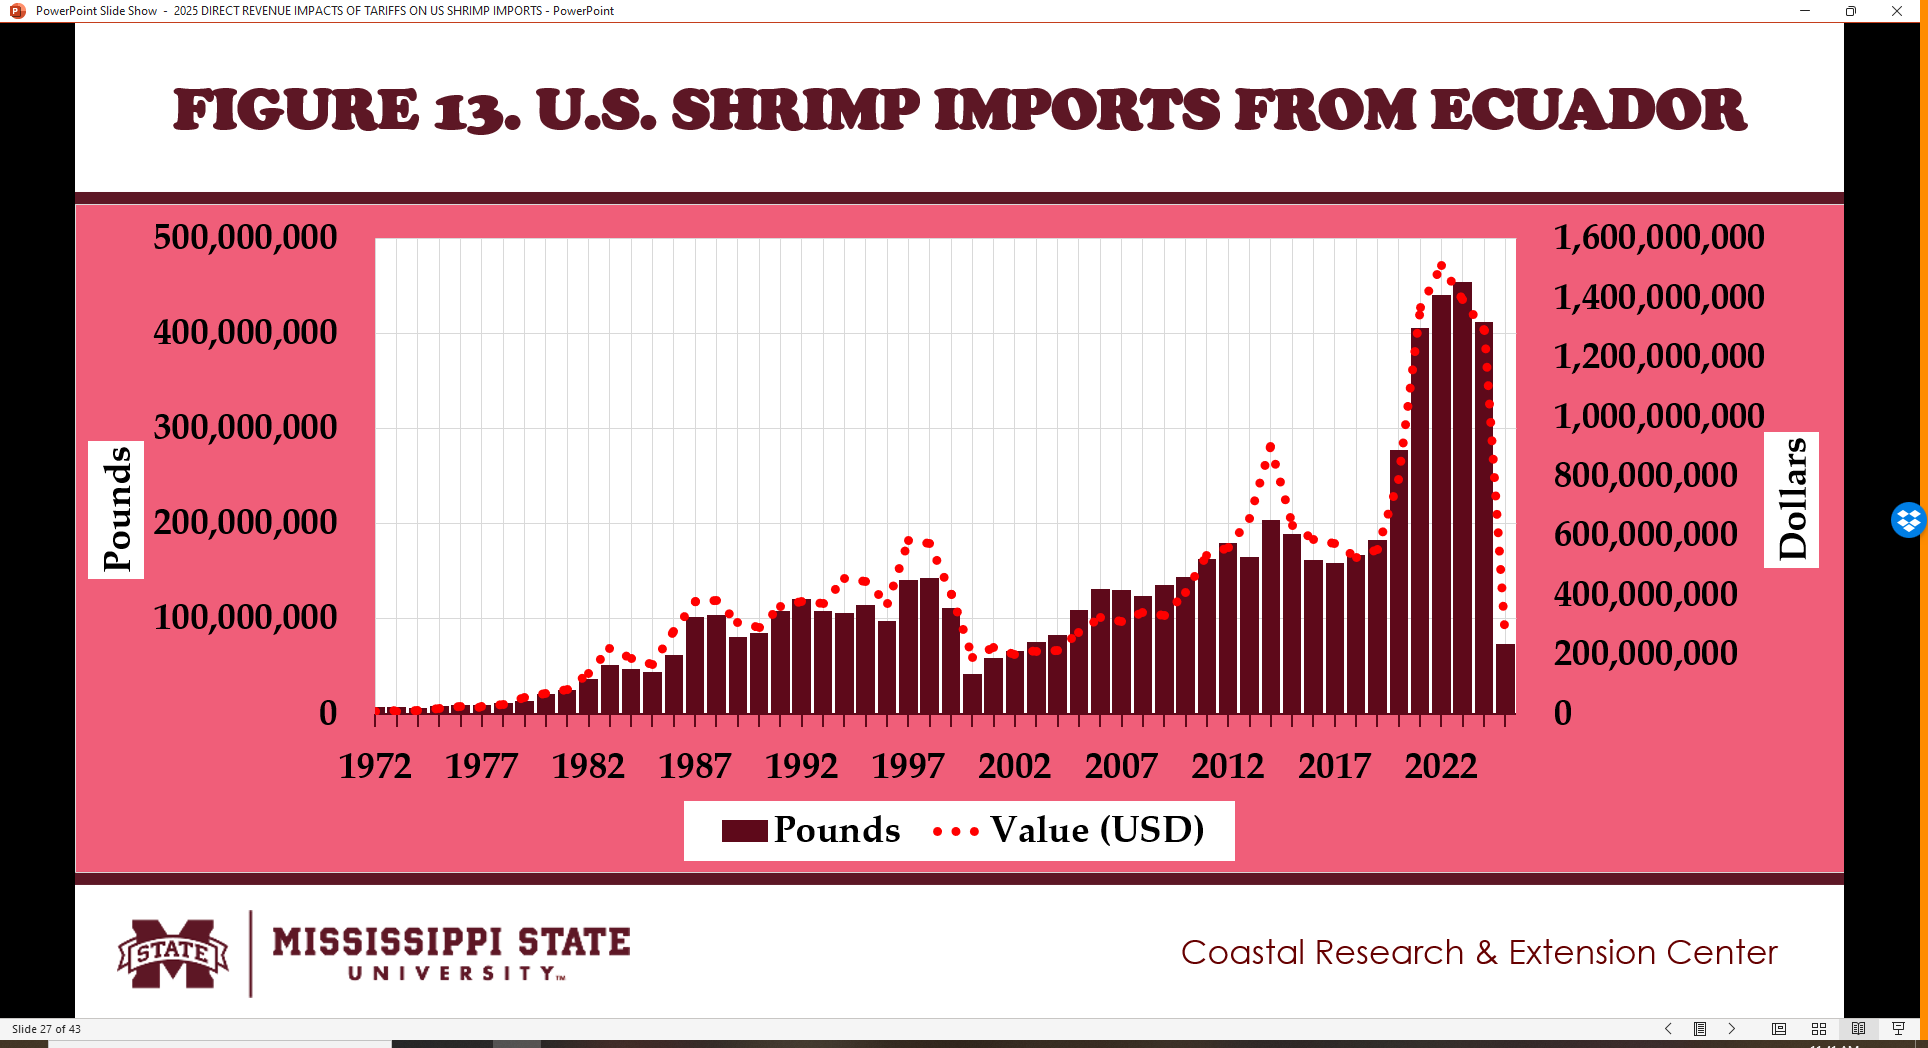
- Second is Ecuador which has not been imposed significant tariff of its shrimp exported to the U.S.
- Total shrimp imports from Ecuador significantly rose when the US-China trade war started in July 2018 (Fig. 13).
- The imputed average price of shrimp imports from Ecuador fell from in 2018 to 2020 and remained slightly above $3.00 since 2021.
- Ecuador enjoyed a comparative advantage with no significant tariffs to ramp up its exports of shrimp products to the U.S. since 2018.

COMPARATIVE U.S. SHRIMP IMPORTS FROM CHINA, ECUADOR AND INDIA
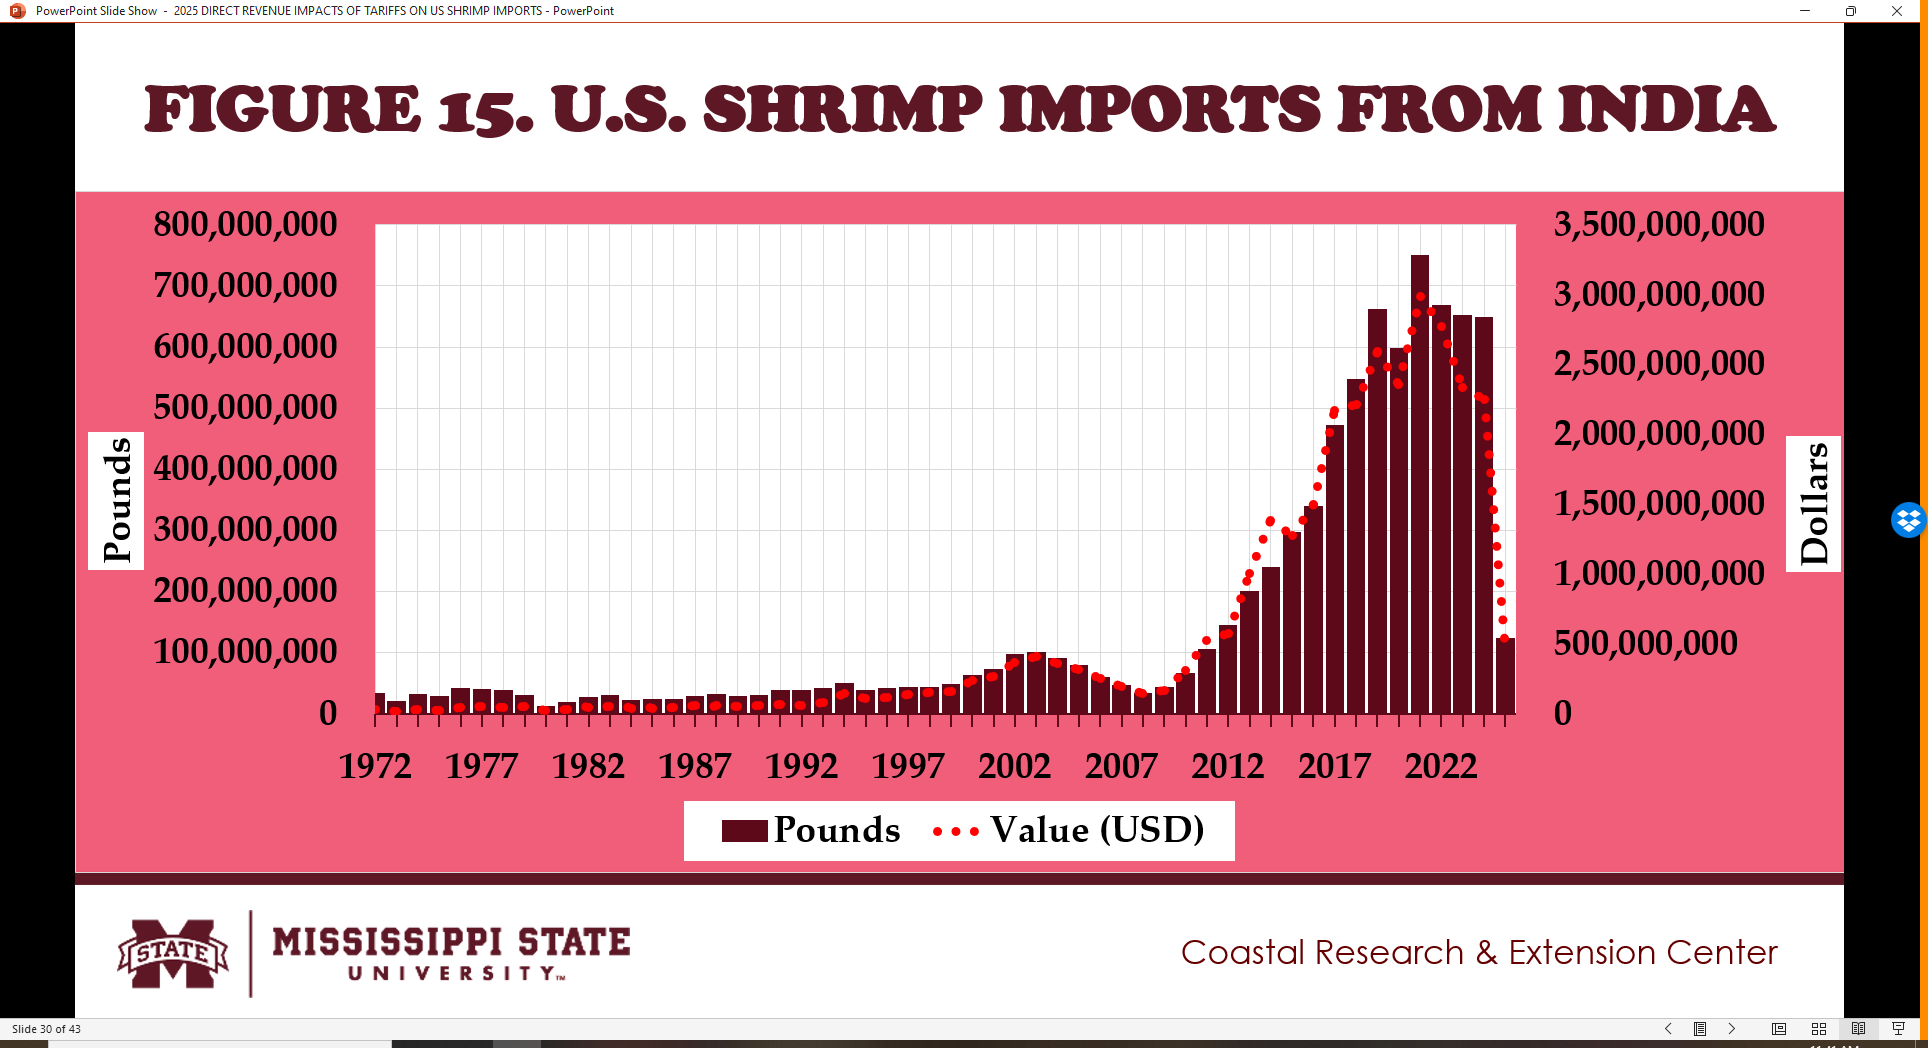
- Third is India which has received an average of five percent tariff on its shrimp exports to the U.S.
- Total shrimp imports from India significantly rose when the US-China trade war started in July 2018 (Fig. 15).
- The imputed average price of shrimp imports from India fell and remained slightly below $3.00 since 2018.
- India took advantage of a lower tariff rate to increase its exports of shrimp products to the U.S. since 2018.
U.S. SHRIMP IMPORTS, 2021-24
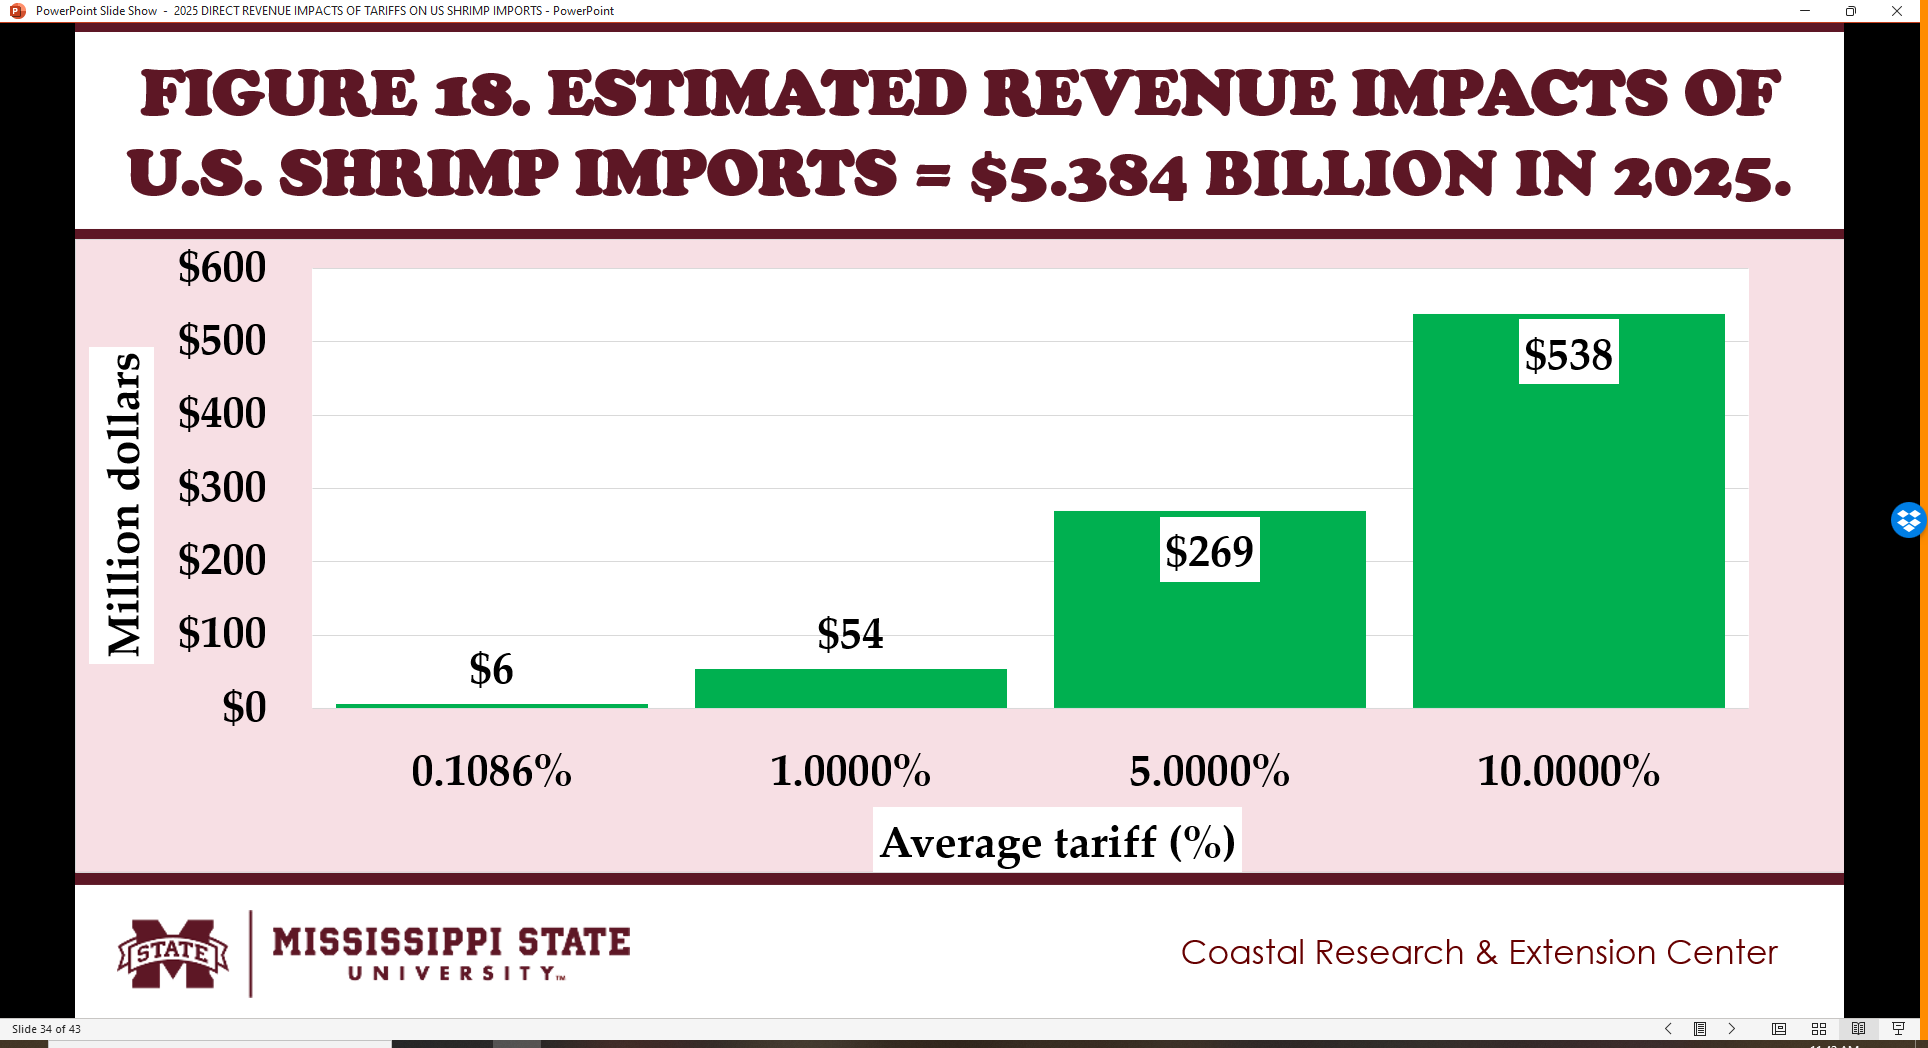
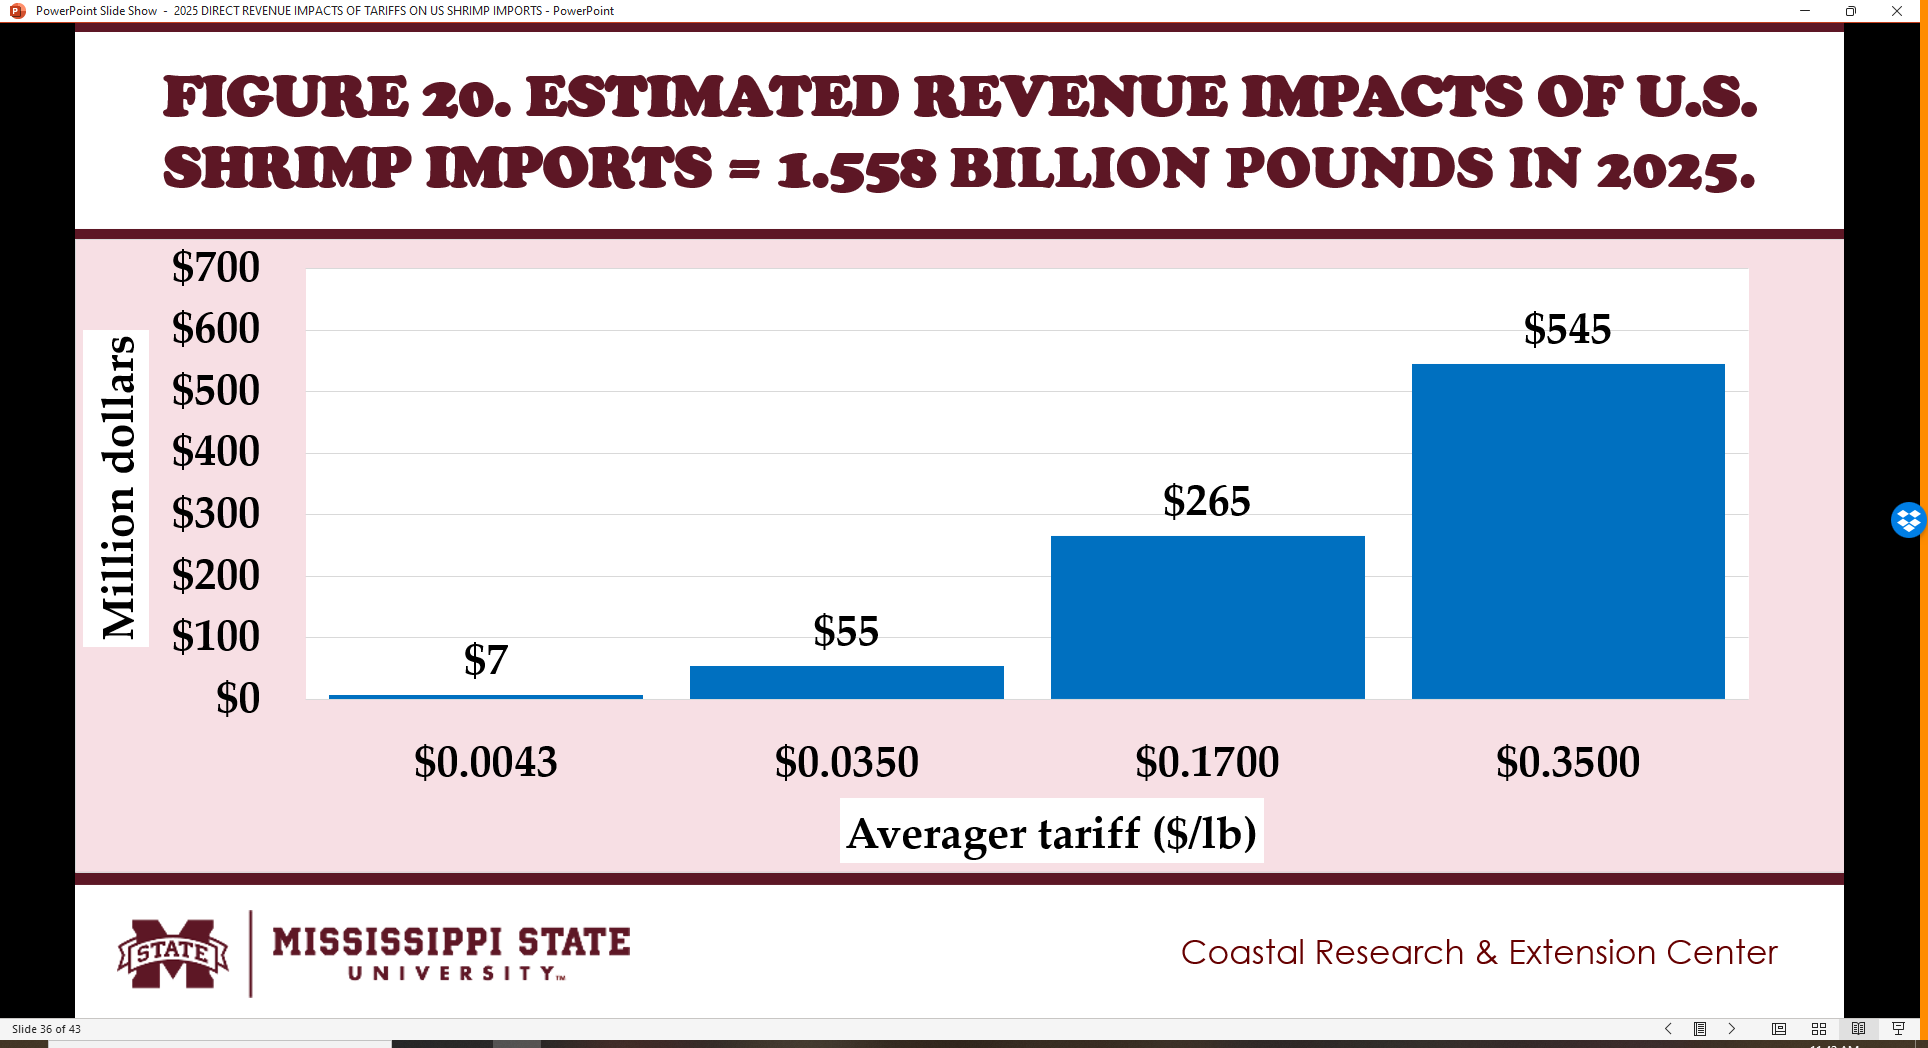
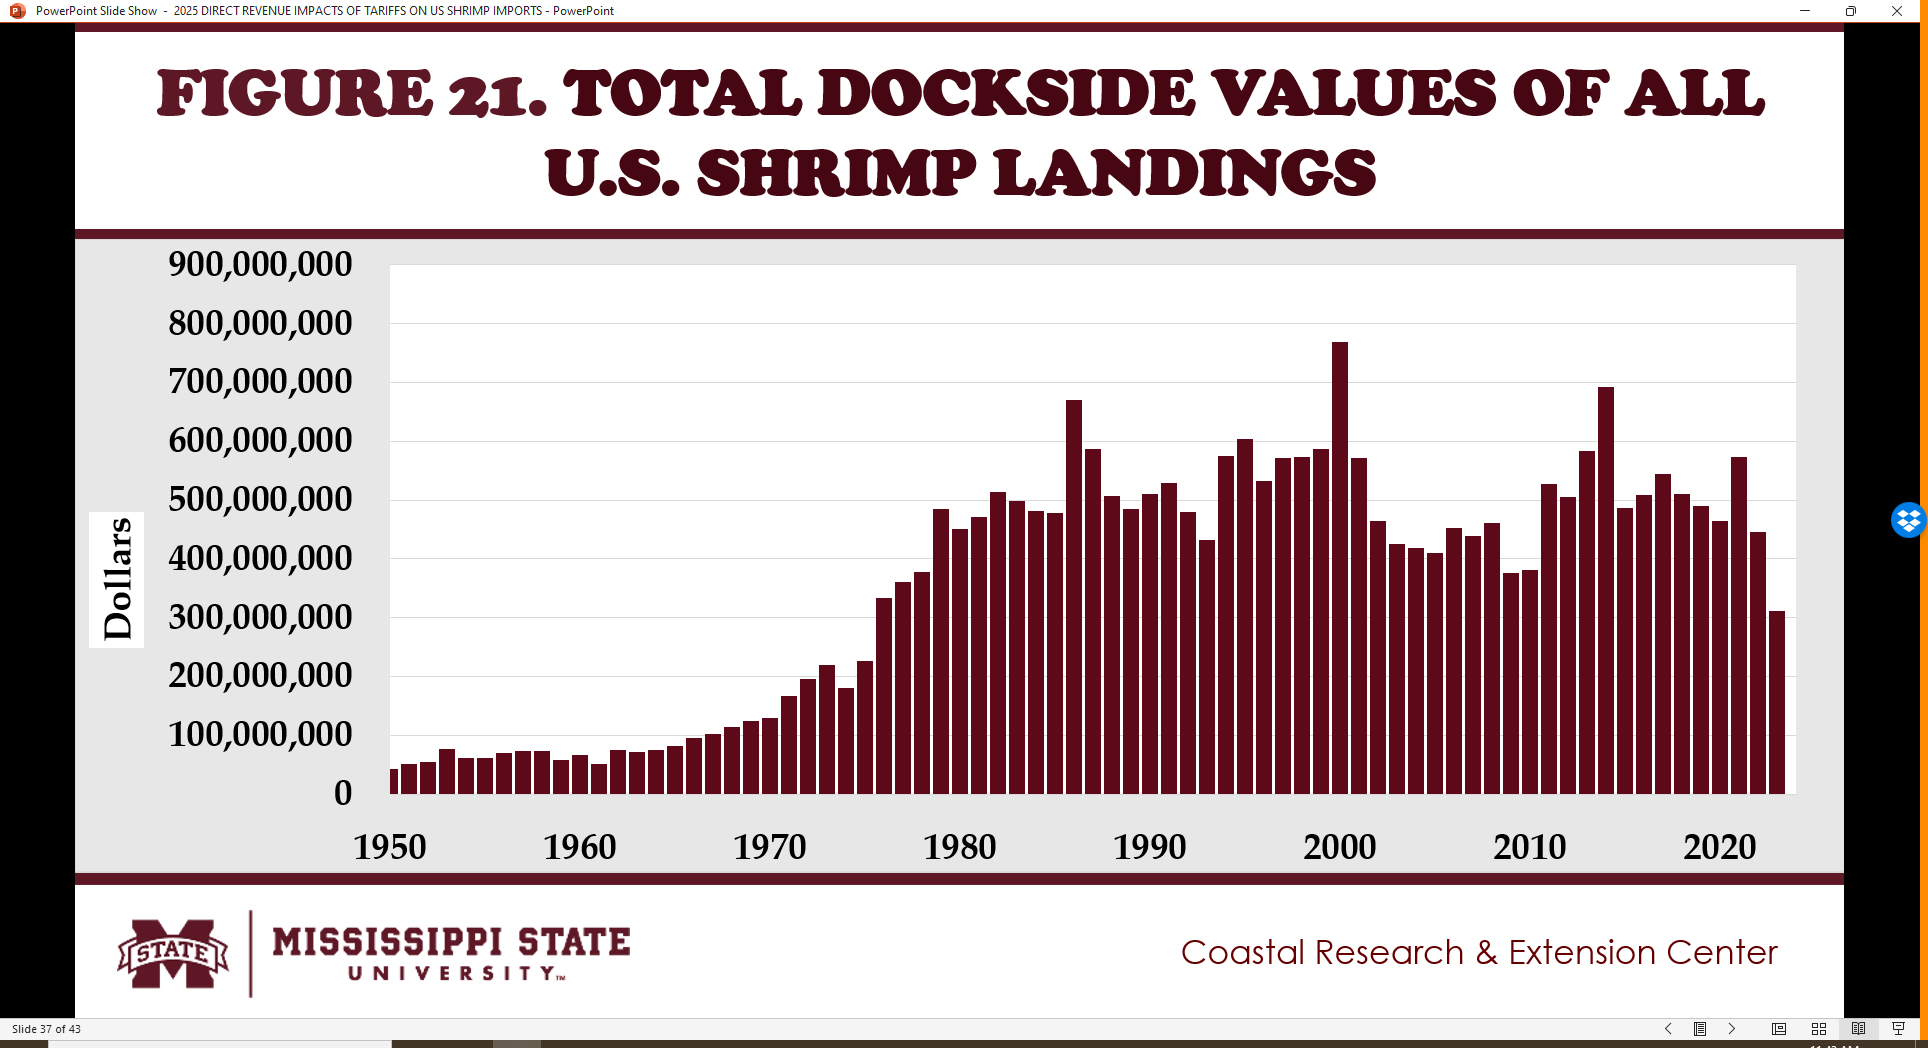
- Fig. 17 to 20 show the downward trends in U.S. shrimp imports from 2021 to 2024.
- If U.S. shrimp imports drop to $5.384 billion in 2025 and tariffs average 10 percent, total tariff revenues will reach $538 million.
- If U.S. shrimp imports fall to 1.558 billion pounds in 2025 and tariffs average $0.35 per pound, total tariff revenues will reach $545 million.
- These expected tariff revenues exceed the total dockside values of all U.S. shrimp landings during the past decade (Fig. 21).
- However, at lower tariff rates on its shrimp imports, the U.S. will still generate significant tariff revenues.

U.S. SHRIMP IMPORTS WITH DUTIES, 2019-24
- Fig. 22 to 23 show the downward trends in U.S. shrimp imports with duties from 2019 to 2024.
- In 2019, the percent of U.S. shrimp imports subjected to duties was 1.934 percent for total value and 3.085 percent for total volume.
- However, in 2024, the percentages went down to 0.534 percent for total value and 0.669 percent for total volume.


SUMMARY, LIMITATIONS AND IMPLICATIONS
- The structure of calculated tariffs levied on U.S. shrimp imports encouraged massive commodity importation.
- Shifts in importation of shrimp products occurred from high to low to no calculated tariffs imposed on different producing countries.
- The imposition of higher tariffs on all U.S. shrimp imports could generate revenues equivalent to the total dockside value of the domestic shrimp landings.
- In 2024, the percentages of U.S. shrimp imports with calculated duties went down to 0.53 percent for total value and 0.67 percent for total volume.
- Even at lower tariff rates on its shrimp imports, the U.S. will still generate significant tariff revenues.
ACKNOWLEDGEMENT
- This newsletter is a contribution of the Mississippi Agricultural and Forestry Experiment Station and the Mississippi State University Extension Service. This material is based upon work supported in part by the National Institute of Food and Agriculture, U.S. Department of Agriculture, Hatch project under accession number 100004. Any opinions, findings, conclusions, or recommendations expressed in this publication are those of the author. They should not be construed to represent any official USDA or U.S. Government determination or policy.
- This work was supported in part by the Mississippi-Alabama Sea Grant Consortium, National Oceanic and Atmospheric Administration, U.S. Department of Commerce, and the states of Alabama and Mississippi—federal grant number NA24OARX417C0155-T1-01. The statements, findings, conclusions, and recommendations are those of the authors and do not necessarily reflect the views of any of these funders.
SUGGESTED CITATION
- Posadas, B.C. 2025. Direct Revenue Impacts of Tariffs on U.S. Shrimp Imports. Vol. 15, No. 5. Mississippi State University Extension and Mississippi-Alabama Sea Grant Publication MASGP-25-058-5. May 20, 2025. https://extension.msstate.edu/newsletters/mississippi-marketmaker.