
Estimating the Economic Impact of Tourism Events
Many local communities have a long-standing tradition of hosting festivals, fairs, and other types of tourism-oriented events. These events may have different themes. For example, some events will focus on the cultural heritage of the community, others may focus on the community’s agricultural or industrial development history, and some may have a sports-oriented theme such as a weekend youth softball or baseball tournament.
These communities range from small, rural communities to large, urban ones. Most locally sponsored events succeed at providing an entertaining experience for their visitors. Even so, organizers of these events may face some questions:
- Why should the community continue to provide public funds for the event? (This question could be asked by a county Board of Supervisors.)
- Does the event generate a sufficient level of economic activity that an outside party (i.e., the state economic development agency or a nonprofit with a mission of providing resources for economic development activities) would be interested in investing grant funds to expand the event? (This question could be asked by the event’s planning committee.)
- Why do we want to bring all of these strangers into the community each year? (This question could be asked by the community’s residents.)
While there are multiple analysis methods that a community can use to answer these types of questions, one of the more popular methods involves surveying a sample of event participants to estimate the level of visitor spending that can be attributed to the event, and then applying the information from the analysis to the total number of attendees. This method provides an estimate of the amount of money coming into the community that can be directly attributed to the event, but also an estimate of the level of economic spillover (commonly called the multiplier effect) that results from these expenditures.
The remainder of this publication provides explanations of the data collection and economic impact analysis process that communities can use to determine the impact of their tourism events.
Data Collection: Developing a Survey Instrument
The first step in determining the level of visitors’ expenditures that can be directly attributed to the event is developing a survey instrument that can be distributed to event participants. You can either develop the survey yourself or adapt an existing survey to fit the event. See Appendix A for a sample instrument that will be used as an example in this publication.
Good survey instruments are difficult to develop from scratch, but it can also be difficult to adapt an existing survey for your purposes. Whether you create your own survey or adapt one, there are a few guidelines to consider:
- Keep the survey as short as possible to obtain the information that you need for the analysis. Remember that the primary focus of the event is for participants to enjoy themselves, not to complete a lengthy survey.
- Determine the information you need for the analysis and discard questions that ask for data that would just be “nice to have.” This editing prevents the survey respondent from wasting their time answering questions that will not be used in the analysis.
- Test the instrument! Distribute the instrument to friends or coworkers and ask them to complete the instrument as if they were event participants. This step is perhaps the most important in the survey development process.
Appendix A presents an example event visitor survey that you are welcome to use as is or modify as your situation warrants. This survey adheres to the three points above.
First, this survey is short. With proper formatting, it could fit on a half-sheet of paper or on a relatively small number of screens if a QR code is used. Potential respondents will understand that it will not take much time to complete the survey instrument.
Second, each question included on the survey instrument provides valuable information for the analysis. Because this is so critical, in the next section, we provide a rationale for including each question of the example survey instrument.
Finally, this survey was tested with a group of volunteers to ensure that the questions obtained the types of responses desired. At least two questions on the survey were revised during the testing process.
Understanding the Survey Instrument Questions
Here, we provide more detail about the purpose of the survey questions on the example survey instrument in Appendix A.
How many people are in your party? (number of adults and number of children)
Once a total attendee count is developed (see below), the information gathered in the survey will be “applied” to that total count. To provide accurate information, it is important to have a good estimate of the number of people in an average party and whether those people are adults or children (adults’ spending patterns tend to be much different than children’s).
What is your residential ZIP code?
This question was originally worded as “Where do you live?” The test respondents typically entered a city or town name, often without naming a state. These responses were confusing because there are many towns and cities in other states that have the same name, making it impossible to tell how to categorize visiting parties (local, day tripper, or overnighter; see below for more complete explanations of these categories). Since a list of ZIP codes and their corresponding towns can be obtained from the U.S. Postal Service, asking for the residential ZIP code is a better way to determine where the respondents reside. ZIP code information gives event organizers information regarding the effectiveness and reach of event marketing efforts.
This question will be used to ensure that the calculated estimates are restricted to the additional economic activity that results from the event. Crompton et al. (2001) suggests that the estimated economic impact attributable to a particular event relates only to new spending by visitors to the community. This research maintains that local area residents should be excluded from these calculations because they would likely spend in their community whether the event was being held or not. While this is a good rule of thumb, particularly in regions that have a relatively large number of amenities that attract local residents’ dollars, an additional question could be added to the survey instrument to clarify how many “additional” dollars (expenditures that they would not normally have made in the study area) local residents spent as a direct result of the event.
Is attending this event your primary reason for being in the area? How important was the event in your decision to come to the area?
Question 3 was originally worded “Why are you visiting the area?” Some test respondents indicated that their reason for visiting the area was “to have fun.” While this is certainly a goal that the event organizers want the visitors to achieve, it does not provide any information about the visitor’s primary purpose for visiting the area. The revised wording as shown in question 3 of Appendix A gives the respondent sufficient guidance to explicitly state whether the event being studied is the primary purpose for visiting the area.
In the same vein as the ZIP code question, these questions provide information on why the participant is in the area. If the event is not the primary reason the participant is visiting the area and/or if the event was not important in the decision to visit the area, then the spending by those participants should be excluded from the analysis. Crompton et al. (2001) refers to these participants as “time switchers” and “casuals.” Time switchers are people who changed the timing of an already scheduled visit to the area in order to attend the event, and casuals are people who were already in the area for another reason and decided to come to the event because it seemed interesting. Both participant types would have spent money in the community even if the event had not occurred. We suggest that non-local residents who answer “yes” to “Is attending this event your primary reason for being in the area?” and respond with a 4 or 5 to “How important was the event in your decision to come to the area?” be included in the analysis. Other responses should exclude those participants from the analysis.
What mode of transportation did you use to get to this event?
This question might not be as important for smaller communities with limited or no public transportation options, or where the event is not conducive to walking or biking. However, for larger communities, responses to this question provide information on which types of transportation options, particularly public transportation options, are being used for the tourism sector.
Event attendees who drive their personal or rental cars or who carpool can be assumed to purchase automobile fuel (gasoline, diesel, or electricity) from establishments in the local study area. These fuel purchases are typically an important factor in estimating the economic impact of the event to the local area.
If you are staying away from home, how many days will you stay in the region?
This question provides important information regarding the event’s economic impact on the local area. Each day that a non-local event attendee remains in the area means that additional dollars are being pumped into the local economy.
On average, how much will your party spend per day while you are in the area?
This question also provides important information regarding the event’s economic impact on the local area. Not only does this question provide a total level of daily spending by the participant or the traveling party, but it also provides a breakdown of the expenses by economic sector that will be important to develop an accurate economic impact estimate.
What other activities will your party participate in while in the area?
Analysis of this question can provide a snapshot of the types of activities event attendees engage in while they are in the area. This information could provide insight into how the current event should be marketed (including joint marketing efforts with other area events) to increase event participation and the event’s economic impact on the local area. Analysis of responses to this question could also provide insight into other types of community events that could attract visitors to the area.
It might be tempting for the analyst to apportion reported expenditures among the responses to this question. However, we discourage this due to the responses obtained from questions 3 and 4. Responses to these questions indicate the importance of the event in the participant’s decision to visit the local area and should determine whether those responses are included in the analysis.
What is your household income?
There may also be questions regarding the necessity of the household income question. This question is included in the instrument for two reasons. First, it provides an indication of the economic status of the event participant. This would be exceptionally important information to use in event marketing efforts. People with higher incomes respond to different marketing strategies than people with lower incomes.
Second, household income responses can, in many cases, allow the organization to determine if it is reaching its target audiences. Attracting unintended audiences could be a bonus, but it also could indicate mission drift for the organization.
Distributing the Survey Instrument
The method of distributing the instrument should be carefully considered. There are two commonly accepted methods of distributing the instrument to respondents. Each method has advantages and disadvantages.
The first method is distributing the instrument to the respondents while they are attending the event. An advantage of this method is that event participants are typically enjoying themselves while they are attending the event and are more likely to complete the survey accurately, increasing the survey response rate as well as the quality of the collected data.
However, this method also has a distinct disadvantage. It is hoped that each survey respondent reports on the entire trip’s expenditures. If the respondent completes the survey while at the festival, the trip isn’t yet completed, and the respondent will have to estimate expenses incurred before they return home.
Another method that has been used with some success is distributing the survey after the event has ended and participants have returned home. This method requires collecting participant contact information at the event and then contacting them via mail, email, or telephone later to obtain responses to the questions. While this method has the advantage of the participants having information for all of the expenses associated with attending the event, there are several disadvantages associated with this method, as well.
While the event participants have returned home and have a complete history of expenditures, there is a strong possibility that they have put the event in the past and may not remember the expenses they incurred on the trip. Furthermore, they may not be as willing to respond to the survey instrument as they would be if you were collecting the data in person, leading to lower response rates and potentially a lower quality dataset.
Another potential issue is getting enough completed surveys to obtain a large and random enough sample to describe the economic ramifications of the event. The number of survey instruments that need to be completed depends on two factors: the number of festival attendees and the desired confidence level of the analysis.
There are several ways to estimate attendance, including using volunteers with counting “clickers” at the event’s entry points, using crowd photos to count participants in a particular area of the event and extrapolating that count to the entire event geography, and counting the number of tickets sold for the event.
Second, the organization must determine the desired level of statistical confidence. As might be expected, a larger sample size is required as the desired level of confidence increases. Figure 1 shows the number of completed surveys needed to achieve different levels of statistical confidence for various levels of event attendance.
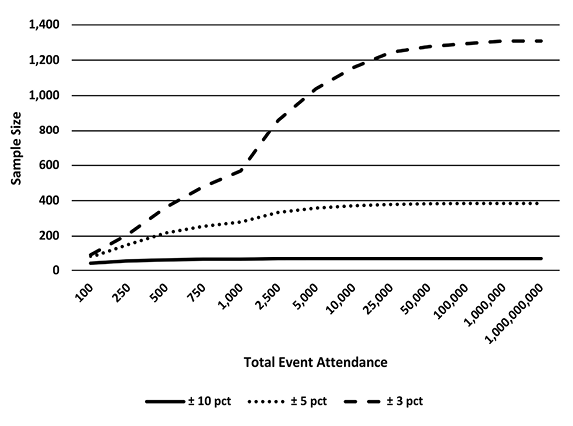
While the scaling on this graph may make it a bit difficult to read, it illustrates the concept of sampling. If you are comfortable with being 90 percent certain that the responses received from the survey represent the event’s total attendance (± 10 percent), then 68 completed random responses would be sufficient if the event’s population is 5,000. If the event’s organizers wanted to increase the confidence in the survey responses to 95 percent, then the sample size would need to increase to 358 completed responses with an attendance of 5,000. Using the same total event attendance, 1,038 completed responses would need to be obtained if the confidence level was 97 percent, and 3,651 completed responses would need to be obtained if the desired confidence was 99 percent (the 99 percent confidence level is not shown on the graph due to scaling factors). Table 1 provides the number of completed random responses for various populations and confidence levels.
While attendance numbers of 25,000 or more may be far beyond the scope of most events, the point is that higher levels of confidence typically require a substantial increase in the number of completed surveys. In most cases, it is adequate to obtain as many survey responses as is feasible and then report the level of confidence that can be derived from the survey numbers.
A final note on implementing the survey process concerns the concept of randomness. Ideally, the analyst should choose a sample size based on the event’s estimated population and then randomly choose potential survey respondents as mentioned in the sample size discussion (e.g., every eighth participant who entered the event’s boundaries could be chosen). In a setting such as the one presented in this discussion, this would be difficult, if not impossible, to achieve for several reasons. First, it is unlikely that there is only one entrance to the event (particularly in the case of festivals), and bias could be introduced into the survey process.
Second, there would likely be large groups (perhaps large families) entering the event together, and it is possible that two or more members from the same traveling party would be chosen (again, this could skew your result). If every eighth group were asked to complete the survey instrument, some type of arbitrary measure to identify the separate groups would have to be implemented. It is unlikely that separate groups (i.e., traveling parties) could be accurately defined, and this method could result in the division of what is actually a single group into two or more parties.
While it is far from a perfect solution, an acceptable strategy would be to cover various areas of the event with “response gatherers” and have as many survey instruments completed as possible by event participants. This option could introduce bias into the analysis process.
Another, more technology-focused method of gathering survey responses is to use an online survey platform (no-cost examples include Google Forms and SurveyMonkey). Giscombe and Canales (2022) provide a guide to using the Google Forms platform combined with a QR (quick response) code to enable participants to access and complete the survey from their smartphones or other internet-capable devices. Displays with QR codes could be distributed throughout the event venue to enable the participants to complete the survey at their leisure, including once they return home from their trip. As with the previous distribution method, bias could be introduced into the results.
|
Total Attendance |
90% confidence ± 10% |
95% confidence ± 5% |
97% confidence ± 3% |
99% confidence ± 1% |
|---|---|---|---|---|
|
100 |
41 |
80 |
93 |
100 |
|
250 |
54 |
152 |
211 |
246 |
|
500 |
60 |
218 |
363 |
483 |
|
750 |
63 |
255 |
478 |
711 |
|
1,000 |
64 |
279 |
568 |
932 |
|
2,500 |
67 |
334 |
860 |
2,111 |
|
5,000 |
68 |
358 |
1,038 |
3,651 |
|
10,000 |
68 |
371 |
1,158 |
5,750 |
|
25,000 |
68 |
380 |
1,244 |
8,778 |
|
50,000 |
68 |
383 |
1,276 |
10,647 |
|
100,000 |
68 |
384 |
1,293 |
11,915 |
|
1,000,000 |
68 |
385 |
1,308 |
13,346 |
|
1,000,000,000 |
68 |
385 |
1,309 |
13,526 |
Analyzing the Data
The first step in analyzing the data will likely be to determine the residential geography of the respondents. This can be accomplished by matching the ZIP code data from the survey instruments to cities and states (a comprehensive list of ZIP codes is available at https://www.unitedstateszipcodes.org/zip-code-database/matching-to-cities-and-counties/). This matching function can be accomplished quite easily with an Excel spreadsheet’s database functions such as vlookup. Consider classifying the event participants into three geographic categories:
- Locals – These are participants who reside in the local area (this area could be the municipality where the event is taking place or a multi-county region). It should be assumed that these participants are not making additional expenditures in the area, but that they are simply shifting their expenditures for goods and services from one vendor in the local area to a vendor associated with the festival. Therefore, these attendees should not be included in the economic impact analysis.
- Day-trippers – These are participants who typically drive in for the event and will not stay in a local lodging establishment (hotel, motel, Airbnb, bed and breakfast, etc.). However, these participants will purchase fuel, food, and sundries that they would not otherwise purchase in the local area. These attendees will be included in the economic impact analysis.
- Overnighters – These are participants who reside a sufficient distance away that making a one-day trip to participate in the event is either not feasible or not convenient. They are assumed to purchase lodging services in the local area in addition to fuel, food, and sundries.
While the sample survey in Appendix A does contain questions concerning the number of days that the respondent plans on remaining in the area as well as a category for lodging expenditures, all participants may not provide a response to the expenditure question. While you could add a question to the survey instrument asking respondents whether area lodging services will be used, you could also 1) assign a radius around the event geography to delineate between day-trippers and overnighters, or 2) assume that in-state attendees are day-trippers and out-of-state attendees are overnighters.
Of these options, the first is likely the most accurate but will require the most work. For this option, you will have to determine the distance between each ZIP code location and the event location. Online software like MapQuest (https://mapquest.com) or Google Maps (https://maps.google.com) can make this easy, but it will likely require a significant amount of time if the event attracts a large number of visitors from a geographically dispersed area.
The second option is to define a specific region for the classification of day-trippers and overnighters. For example, a study developed for a festival in north-central Mississippi classified anyone who resided within Mississippi but outside the three-county study area as a day-tripper and anyone who resided outside the state as an overnighter. It is likely that there were people who lived in Alabama, Arkansas, or Louisiana and drove in for the day and then drove back home without spending the night in the area. It is also likely that there were people attending the festival who resided near the Mississippi Gulf Coast who spent the night in an area hotel or bed and breakfast. However, the attendees were only asked whether they resided in the local study area and about their state of residence, so it was not possible to define a rule set by distance.
In most cases, questions regarding the visitor expenditures will be gathered on a per-party basis. Therefore, the event’s attendance should be converted from a person basis to a party basis. There are several methods for calculating this estimation.
- If the number of survey responses is sufficient in the analyst’s mind to support the estimate, calculate the average size of the party as indicated by the survey. Divide the estimated attendance by the calculated average party size to obtain an estimated number of parties attending the event.
- If there are not enough responses or if a survey instrument was not used, an estimated number of parties can be obtained by dividing the estimated attendance by the number of vehicles in the event’s parking area. This method is made more difficult if parking is in multiple areas, such as along all streets in the town or if there is reason to believe that a substantial number of participants will use public transportation.
- Volunteers posted at the entrances to the event can “eyeball” the sizes of groups of people entering the event. Average these eyeball estimates and divide that average into the estimated event attendance to obtain an estimated number of parties.
Once the number of parties attending the event has been estimated, the parties should be classified using the locals, day-trippers, and overnighters spending pattern categories. If a survey has been implemented, this should be quite simple.
If a survey has not been used, there are some strategies to estimate the proportion of parties that fall into the three spending pattern categories. If the event has a relatively central parking area, a count of license plates from different counties and states may be performed with relatively little effort. Another strategy is to have volunteers verbally ask several participants where they reside. In either case, counts or responses can be analyzed to classify parties into each spending category.
Once the parties have been estimated and classified, the next step involves estimating an average level of spending per party. If a survey has been employed, then the average expenditure per party can be estimated relatively easily for each of the expenditure categories.
However, if too few respondents answered the survey’s expenditure questions, these types of questions were not asked, or a survey was not used, a standard per diem of expenditures can be developed. Tom Van Hyning, Tourism Economist and Data Analyst for the Mississippi Development Authority, assisted this study’s authors in developing a set of expenditure estimations to measure the economic impact of festival attendance on a three-county area in north-central Mississippi. These rates are presented on a per day, per party basis.
Note that these rates should be used as a guide to estimate per-party expenditures. They should be adjusted based on location and the prices of goods and services in the local area.
|
Expenditure Type |
Day-Trippers |
Overnighters |
|---|---|---|
|
Food purchases |
$50/day |
$50/day |
|
Retail purchases |
$20/day |
$20/day |
|
Fuel purchases |
$20/day |
$20/day |
|
Lodging purchases |
n/a |
$135/night |
Estimating the Initial Economic Impact
To illustrate the concept of calculating the economic impact of an event on a local area, we present a fictional example of a one-day festival held in Carrolton, Mississippi, the county seat of Carroll County. While all festival activities will be held in Carroll County, the festival organizers felt that two additional counties (Leflore and Montgomery) would be directly affected by festival expenditures due to the availability of lodging accommodations and restaurants in these counties.
Festival organizers estimated that 1,500 people attended the festival. Analysis of the festival survey revealed that the average party size was 2.3 people. Fifty-five percent of the festival attendees resided in the three-county local area, 30 percent of attendees resided outside the local area but within Mississippi, and 15 percent resided outside Mississippi.
Analysis further revealed that, for the attendees who resided outside the three-county study area, parties spent an average of $65 on food, $25 for miscellaneous retail purchases, $40 for fuel, and $160 for lodging. This led to the following estimations:
- Attendance: 1,500 people
- Average party size: 2.3 people
- Estimated number of parties (1,500 ÷ 2.3): 652
- Local parties (652 × 55 percent): 359
- Day-tripper parties (652 × 30 percent): 196
- Overnighter parties (652 × 15 percent): 98
However, there is one issue to address: Retail goods are typically imported into the community. For example, fuel (gasoline or diesel) is likely not refined in the local study area, but stores that sell fuel purchase that product in its final form and then resell it. The same is true of the typical retail good (clothing or food products purchased in a grocery store). This is not necessarily the case for food purchased in a restaurant.
The IMPLAN software (discussed below) has estimates of county- and region-specific measures for the value that a retail store adds to its purchases, whether it is fuel or clothing. In the case of fuel purchases for this region, only 22.9 percent of the final product sold to consumers is value added by the business in the local region. In the case of general retail purchases made in the local region, only 34.1 percent of the final product sold to consumers is value added by the businesses in the local region.
These findings led to the direct expenditure estimations shown in Table 3. It is important to note that these purchases were made outside the event venue.
In addition, the event’s organizers mandated that vendors operating inside the event provide sales information and pay sales tax on the sales that were made so that Carrollton would receive diversions (18.5 percent of the total sales tax collected) from the Mississippi Department of Revenue. Vendors reported $2,970 in event sales. However, for this example, these vendors are outside of the study area, so the level of product sales would not be counted in the initial economic impacts to the area. The only amount that would be counted is the amount of the diversion to Carrollton that results from these sales ($2,970 × 7 percent sales tax × 18.5 percent diversion to Carrollton = $38). This brings the initial economic impact to $40,022.
|
Expenditure Category |
Day-Trippers |
Overnighters |
Day-Trippers + Overnighters |
|---|---|---|---|
|
Food purchases |
$65 × 196 = $12,740 |
$65 × 98 = $6,370 |
$12,740 + $6,370 = $19,110 |
|
Retail purchases |
$25 × 196 = $4,900 |
$25 × 98 = $2,450 |
$4,900 + $2,450 × 34.1% = $2,505 |
|
Fuel purchases |
$40 × 196 = $7,840 |
$40 × 98 = $3,920 |
$7,840 + $3,920 × 22.9% = $2,689 |
|
Lodging purchases |
not applicable |
$160 × 98 = $15,680 |
$0 + $15,680 = $15,680 |
|
Total of Estimated Expenditures: $39,984 |
|||
Carrying Economic Impact to the Next Level
While $40,022 is a substantial addition to the three-county study area economy, there are other economic effects to consider. When the authors undertake this type of study, they typically use IMPLAN software to estimate the economic spillover effects from an event like the example presented here.
In the example, the initial economic impacts calculated are normally referred to as the direct effects. Economic spillover effects consist of business-to-business transactions that are attributable to spending by event participants and induced effects, which are employee purchases that are attributable to the spending by event participants. The sum of the direct effects, the indirect effects, and the induced effects are typically referred to as the total economic effect.
In addition, IMPLAN estimates the fiscal effects (taxes paid) to local, state, and federal governments that are a result of the spending by event participants. Local government taxes can be disaggregated into those collected for the county general fund and those collected by sub-county taxing districts such as school districts and municipalities.
Unfortunately, IMPLAN is a relatively expensive software package, and the learning curve to understand and effectively use the software is quite steep. However, Mississippi State University economists in the Extension Service and Forest and Wildlife Research Center are available to assist communities in this type of analysis. For more information, please contact the authors.
To help you determine whether the estimation of the economic spillover benefits would be beneficial to your effort, a summary of the IMPLAN estimates for the example event is presented here:
Given the direct sales effects calculated earlier, we estimate that a total of 0.7 full- and part-time jobs earning $13,871 were created as a result of the spending by event participants. In addition, business-to-business transactions combined with employee purchases that were attributable to the event resulted in an additional $16,331 in sales and $7,706 in value that was added to the three-county economy.
In addition, the county collected an estimated additional $1,016 in tax revenue from event participant spending. We also estimated that the state government earned an additional $3,131 and the federal government earned an additional $3,352 from spending at the event.
Conclusions
While this example event is relatively small, the conclusions can be applied to an event of any size. The 676 people who attended the event and resided outside the three-county area supported an estimated 0.70 jobs earning $15,347.47 in labor income, contributed an additional $25,921.98 in value added and $56,393.12 in output from their expenditures of $53,900.
In addition, local governments accrued an estimated $1,579.42 from visitor expenditures and the state government accrued an additional $4,025.05. These contributions to governmental coffers are important for two reasons. First, the additional fiscal revenues generated from the event provide resources for local, state, and federal governments to provide valuable services to constituents. Second, providing an estimate of tax dollars that the event contributes to governments may strengthen the possibility that local or state governments will provide support to the event, whether in the form of in-kind services (such as providing police officers for additional security) or direct dollars.
References
Crompton, J. L., Lee, S., & Shuster, T. J. (2001). A guide for undertaking economic impact studies: The Springfest example. Journal of Travel Research, 40, 79–87.
Giscombe, S., & Canales, E. (2022). Using online surveys to collect data for farmers markets. Mississippi State University Extension Publication 3767. http://extension.msstate.edu/publications/using-online-surveys-collect-data-for-farmers-markets
Hayes, A. (2022, October 1). Value-added product: What it means in industry and marketing. Investopedia. https://www.investopedia.com/terms/v/valueadded.asp
Smith, S. M. (n.d.). Determining sample size: How to ensure you get the correct sample size. Qualtrics. https://uncw.edu/irp/ie/resources/documents/qualtrics/determining-sample-size-2.pdf
Appendix A. Example Survey
See the PDF above for an example community event visitor survey.
The information given here is for educational purposes only. References to commercial products, trade names, or suppliers are made with the understanding that no endorsement is implied and that no discrimination against other products or suppliers is intended.
Publication 3833 (POD-12-22)
By Alan Barefield, PhD, Extension Professor, Agricultural Economics; Devon Meadowcroft, PhD, Assistant Professor, Delta Research and Extension Center; and Emily V. Durr, former student assistant, Agricultural Economics.

The Mississippi State University Extension Service is working to ensure all web content is accessible to all users. If you need assistance accessing any of our content, please email the webteam or call 662-325-2262.