
Mississippi Economic and Financial Well-Being: Patterns and Trends
Mississippi has long experienced significant poverty and financial distress. Approximately one in five Mississippians lives in poverty (U.S. Census Bureau, 2021b). Mississippi ranks second to last in overall child well-being among the 50 states, considering measures such as children in poverty, children not in school, children without health insurance, and teen births (Annie E. Casey Foundation, 2021). As of 2019, Mississippi’s unemployment rate is the highest of all 50 states and the District of Columbia (U.S. Bureau of Labor Statistics (BLS), 2019), and a persistent income gap exists between Mississippi and the rest of the U.S. (U.S. Census Bureau, 2021c). Additionally, many households rely on alternative financial services (AFS), cannot save for emergencies, and have volatile income.
Historically, the well-being of a country was measured by gross national product (GNP) and gross domestic product (GDP) (Fox, 2012). However, only considering the production of goods and services may mask the importance of other attributes on the quality of life of individuals residing in an area. Well-being remains a challenging concept to measure, and several different indicators may be studied. Recently, happiness, educational attainment, and life expectancy are also being examined to measure well-being (Fox, 2012). The Consumer Financial Protection Bureau (CFPB) defines financial well-being as having “financial security and financial freedom of choice” in the present and the future (CFPB, n.d.).
State and local elected and community leaders are often mainly focused on unemployment, regional GDP, changes in industries, and per capita income. Extension experts and regional economic development researchers at Mississippi State University provide economic profiles to help state and local leaders understand the current economic issues in Mississippi and identify potential solutions.
This publication expands the scope of measuring local economic growth by considering a fuller picture of the economic and financial well-being of Mississippi households over time. This is fundamental to a region’s sustainable economic development. To understand the economic and financial well-being of Mississippi households, we investigate a broad set of economic and financial indicators, such as poverty, income, unemployment, labor force participation, net worth, asset and debt composition, banking status, financial security, and alternative financial services. Strong household economic well-being contributes to the accumulation of human capital, a major factor in improving the local economy.
Where Mississippians Stand with Economic and Financial Well-Being
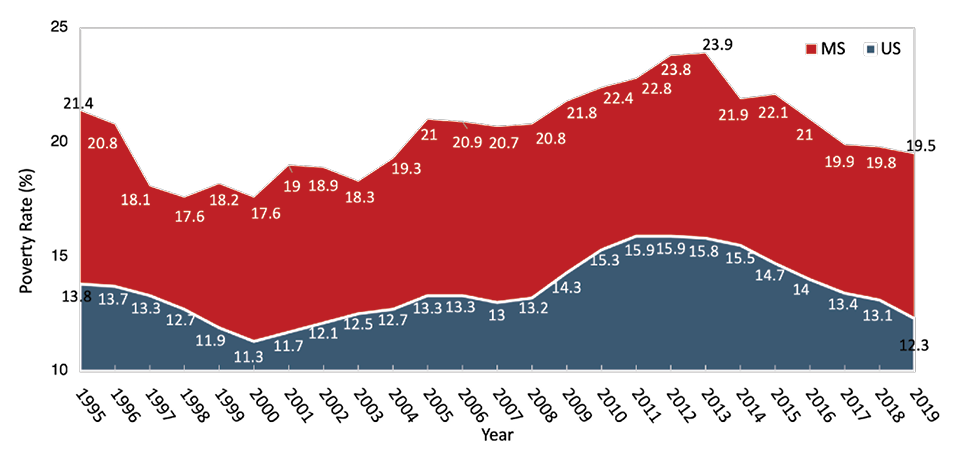
Poverty is deeply entrenched in Mississippi. About one in five Mississippians were reported to be living in poverty in 2019. The 2019 poverty rate is estimated as 19.5 percent, with about 564,000 residents living in some degree of poverty (SAIPE, U.S. Census 2019). Figure 1 shows that a large gap between Mississippi’s poverty rate and that of the United States has existed since at least 1995. This gap increased in the aftermath of large economic shocks such as Hurricane Katrina (2005) and the Great Recession (2007–2009). It is interesting to note that increases in poverty in Mississippi typically lag the national economic shock by a matter of years; for example, the poverty rate sharply increased to 23.9 percent in 2013; this is at least three years after the end of the Great Recession. The poverty gap between Mississippi and the U.S. as a whole seems to have improved since 2013. The 2019 Mississippi poverty rate of 19.5 percent is below the average for 1995–2019 (20.6 percent). Furthermore, while the Mississippi poverty rate has more variation between years than the U.S. rate, Mississippi seems to be tracking with the U.S. more closely since 2013.
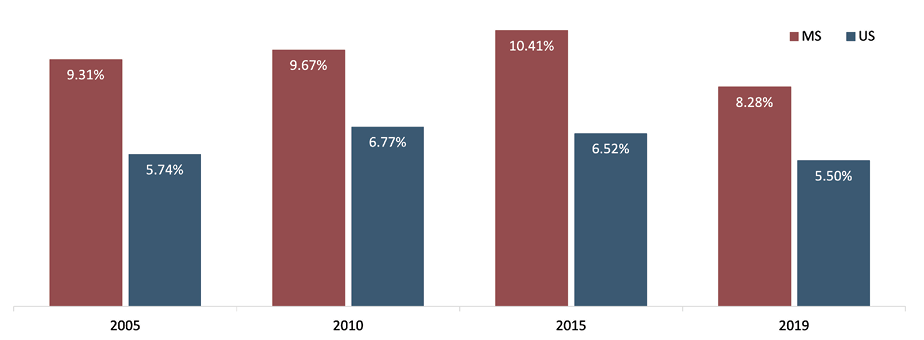
The deep poverty rate is the most common measure of severe deprivation. Deep poverty is defined as having resources less than 50 percent of the poverty threshold (i.e., living in a household with an income below 50 percent of its poverty threshold). Figure 2 presents the number of people in Mississippi and the U.S. who earn this level of income. These data reveal that, although the gap in the deep poverty rate between Mississippi and the U.S. has varied from 2005 to 2019, this gap is at its smallest level for the years shown in 2019. Even so, the state’s deep poverty rate is still 2.8 percentage points higher than the U.S. average in 2019. It is reassuring to note that, although Mississippi seemed to experience increases in the deep poverty rate when the U.S. saw declines between 2010 and 2015, Mississippi seems to be tracking the U.S. rate more closely between 2015 and 2019.
|
Year |
MS (%) |
U.S. (%) |
|---|---|---|
|
1995 |
21.4 |
13.8 |
|
1996 |
20.8 |
13.7 |
|
1997 |
18.1 |
13.3 |
|
1998 |
17.6 |
12.7 |
|
1999 |
18.2 |
11.9 |
|
2000 |
17.6 |
11.3 |
|
2001 |
19 |
11.7 |
|
2002 |
18.9 |
12.1 |
|
2003 |
18.3 |
12.5 |
|
2004 |
19.3 |
12.7 |
|
2005 |
21 |
13.3 |
|
2006 |
20.9 |
13.3 |
|
2007 |
20.7 |
13 |
|
2008 |
20.8 |
13.2 |
|
2009 |
21.8 |
14.3 |
|
2010 |
22.4 |
15.3 |
|
2011 |
22.8 |
15.9 |
|
2012 |
23.8 |
15.9 |
|
2013 |
23.9 |
15.8 |
|
2014 |
21.9 |
15.5 |
|
2015 |
22.1 |
14.7 |
|
2016 |
21 |
14 |
|
2017 |
19.9 |
13.4 |
|
2018 |
19.8 |
13.1 |
|
2019 |
19.5 |
12.3 |
|
|
U.S. |
MS |
||||||
|---|---|---|---|---|---|---|---|---|
|
Year |
2005 |
2010 |
2015 |
2019 |
2005 |
2010 |
2015 |
2019 |
|
Population for whom poverty status is determined |
287,270,432 |
301,535,021 |
313,476,400 |
320,118,791 |
2,812,795 |
2,875,594 |
2,896,579 |
2,877,843 |
|
Below poverty level |
38,231,474 |
46,215,956 |
46,153,077 |
39,490,096 |
600,288 |
643,883 |
637,128 |
564,192 |
|
Poverty rate |
13.3% |
15.3% |
14.7% |
12.3% |
21.3% |
22.4% |
22.0% |
19.6% |
|
50 percent of poverty level |
16,478,349 |
20,413,453 |
20,441,866 |
17,602,164 |
261,948 |
278,168 |
301,574 |
238,168 |
|
Deep poverty rate |
5.7% |
6.8% |
6.5% |
5.5% |
9.3% |
9.7% |
10.4% |
8.3% |
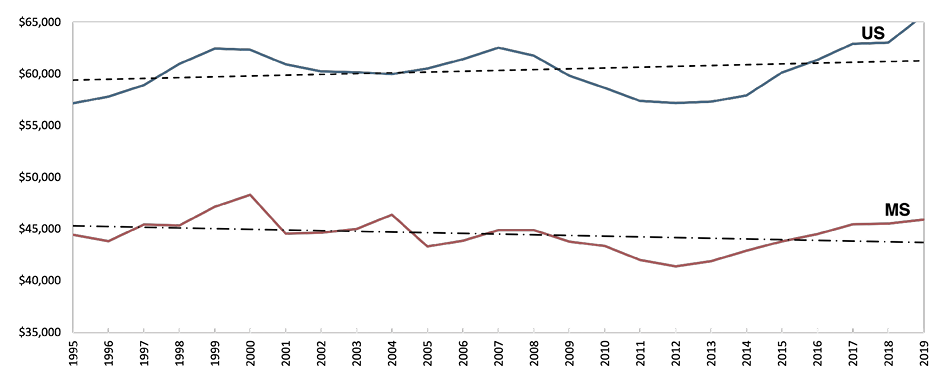
Low income is the direct driver of poverty. Figure 3 presents the levels of real (adjusted for inflation) median household income over time for Mississippi and the U.S. Decreasing median income in Mississippi from 2004 to 2005 was caused by the deteriorated state economy from Hurricane Katrina in 2005, rather than following the national economic cycle. This exception aside, it is important to note that until 2012, changes in this metric for Mississippi tended to lag the U.S. by at least one year until 2012. Since 2012, changes in real median household income for Mississippi has tended to track the U.S. much more closely. Aside from this exception, Mississippi’s median income tracks close to the national trend, possibly indicating a change in the structure of Mississippi’s economy. In 2019, the median household income in Mississippi was $45,928, while the national level was $65,712.
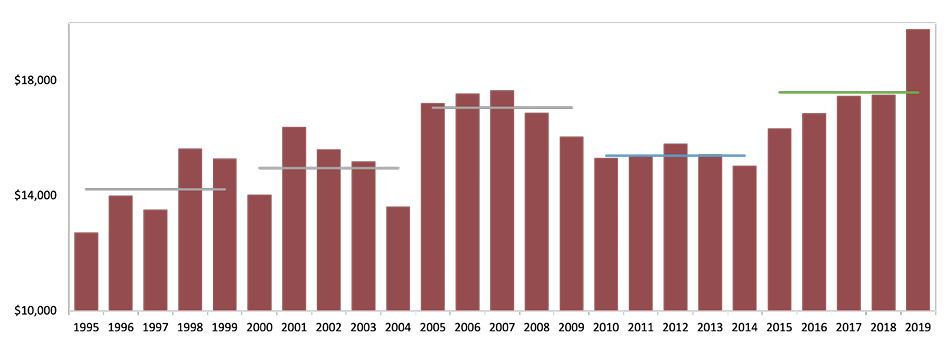
Figure 4 presents the real median household income gaps over time between Mississippi and the U.S., with the horizontal bars representing the various five-year income gap averages. The median household income gap between Mississippi and the U.S. has persistently been more than $10,000 since 1995 and significantly increased following economic recessions in 2001 and 2007, which saw gaps of more than $15,000. This implies that Mississippi household finances are more susceptible to national economic shocks, and building a resilient regional economy is critical for the state. After the last economic recession, the median income gap narrowed to around $14,000, but it has experienced annual increases through 2019. The 2019 gap is reported as $19,784.
|
|
1995 |
1996 |
1997 |
1998 |
1999 |
2000 |
2001 |
2002 |
2003 |
2004 |
2005 |
2006 |
2007 |
2008 |
2009 |
2010 |
2011 |
2012 |
2013 |
2014 |
2015 |
2016 |
2017 |
2018 |
2019 |
|---|---|---|---|---|---|---|---|---|---|---|---|---|---|---|---|---|---|---|---|---|---|---|---|---|---|
|
U.S., median income |
34076 |
35492 |
37005 |
38885 |
40696 |
41990 |
42228 |
42409 |
43318 |
44334 |
46242 |
48451 |
50740 |
52029 |
50221 |
50046 |
50502 |
51371 |
52250 |
53657 |
55775 |
57617 |
60336 |
61937 |
65712 |
|
MS, median income |
26501 |
26901 |
28527 |
28925 |
30739 |
32542 |
30877 |
31434 |
32397 |
34278 |
33090 |
34615 |
36424 |
37818 |
36764 |
36992 |
36963 |
37179 |
38191 |
39738 |
40630 |
41793 |
43595 |
44740 |
45928 |
|
CPIU, BLS |
152.4 |
156.9 |
160.5 |
163.0 |
166.6 |
172.2 |
177.1 |
179.9 |
184.0 |
188.9 |
195.3 |
201.6 |
207.3 |
215.3 |
214.5 |
218.1 |
224.9 |
229.6 |
233.0 |
236.7 |
237.0 |
240.0 |
245.1 |
251.1 |
255.7 |
|
U.S. |
57168 |
57835 |
58948 |
60993 |
62454 |
62341 |
60959 |
60268 |
60188 |
60002 |
60533 |
61443 |
62563 |
61781 |
59847 |
58676 |
57399 |
57203 |
57341 |
57946 |
60161 |
61374 |
62930 |
63059 |
65712 |
|
MS |
44459 |
43836 |
45443 |
45370 |
47174 |
48314 |
44573 |
44671 |
45014 |
46392 |
43316 |
43897 |
44912 |
44906 |
43811 |
43371 |
42011 |
41399 |
41912 |
42914 |
43825 |
44518 |
45469 |
45551 |
45928 |
|
U.S.-Mississippi gap |
12708 |
13999 |
13505 |
15623 |
15280 |
14027 |
16386 |
15597 |
15174 |
13610 |
17217 |
17546 |
17652 |
16875 |
16036 |
15305 |
15388 |
15803 |
15429 |
15031 |
16336 |
16856 |
17461 |
17509 |
19784 |
|
Years |
Average gap |
|---|---|
|
1995-1999 |
14223 |
|
2000-2004 |
14959 |
|
2005-2009 |
17065 |
|
2010-2014 |
15391 |
|
2015-2019 |
17589 |
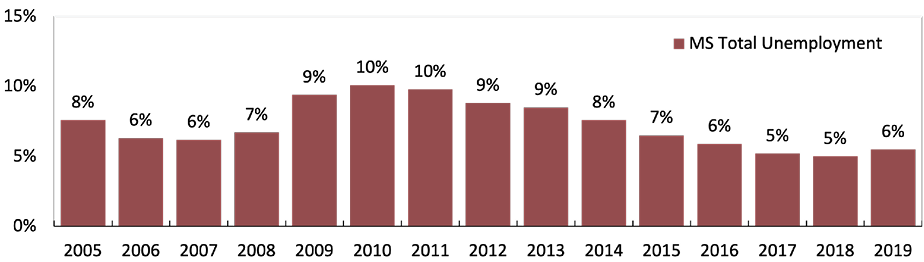
The unemployment rate (the percentage of the labor force that is jobless and looking for a job; those without a job who are not seeking employment are not included in the unemployment rate; BLS, 2015) is also significantly correlated with the poverty rate, meaning that poverty rates are higher with higher unemployment rates (Hoynes, Page, and Stevens, 2005). Mississippi has consistently had a higher unemployment rate than the U.S. average. In 2019, the unemployment rate in Mississippi was 5.5 percent, while it was 3.7 in the U.S. The data in Figure 5 reveal that the overall unemployment rate in Mississippi spiked to 10.1 percent in 2010, and slightly decreased through 2018 (2019 saw a slight increase). Figure 5 also shows that there were three phases of increasing unemployment rates in Mississippi resulting from economic recessions in 2001 and 2007–2009 and Hurricane Katrina in 2005.
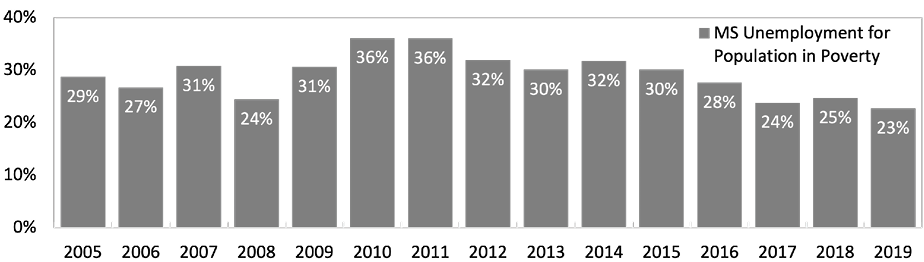
Figures 5 and 6 present the unemployment and labor force participation rates of the population living in poverty in Mississippi. The labor force participation rate measures the number of people in the labor force as a percentage of the population that is either working or actively seeking work (BLS, 2015). The unemployment rate among the population living in poverty is higher than the overall Mississippi average by as much as three times. Mississippi’s unemployment rate rose to 10.1 percent in 2010 and declined to 5.5 percent by 2019. Meanwhile, the unemployment rate among the poverty population reached 36 percent in 2010 and 2011. It has generally declined since 2010 and was 22.7 percent in 2019.
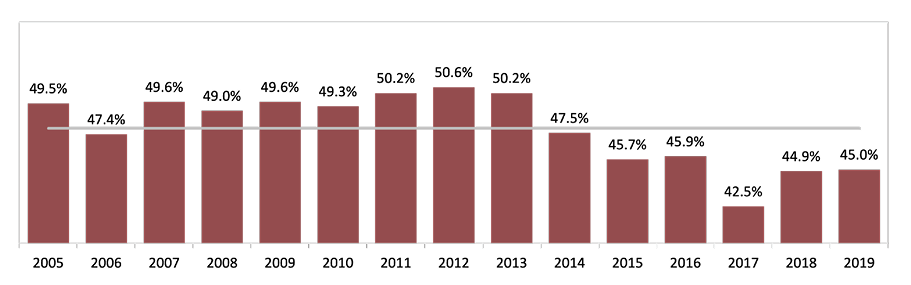
The labor force participation rate also reveals a great deal about Mississippi’s population that lives in poverty. In 2019, only 45 percent of the people in poverty who were 16 years of age or older were either working or seeking jobs. Therefore, out of 100 people over 16 years old and living in poverty, 55 people did not work or gave up finding a job (these are the people who are not in the labor force), 35 people were working (employed persons), and 10 people were looking for a job (unemployed persons among the population in poverty). As an example, suppose 100 people are living in poverty. The labor participation rate in this group is 45 percent. Therefore, 45 people (100 × 45% = 45) participated the labor market and 55 people (100 - 45) were not in the labor market. Among the labor participants (45 people), the unemployment rate was 23 percent, so 10 people (45 × 23% = 10) were unemployed but looking for a job, while 35 people (45 - 10 = 35) were employed.
|
Year |
Mississippi total unemployment |
Mississippi unemployment for population in poverty |
|---|---|---|
|
2005 |
8% |
29% |
|
2006 |
6% |
27% |
|
2007 |
6% |
31% |
|
2008 |
7% |
24% |
|
2009 |
9% |
31% |
|
2010 |
10% |
36% |
|
2011 |
10% |
36% |
|
2012 |
9% |
32% |
|
2013 |
9% |
30% |
|
2014 |
8% |
32% |
|
2015 |
7% |
30% |
|
2016 |
6% |
28% |
|
2017 |
5% |
24% |
|
2018 |
5% |
25% |
|
2019 |
6% |
23% |
|
|
2005 |
2006 |
2007 |
2008 |
2009 |
2010 |
2011 |
2012 |
2013 |
2014 |
2015 |
2016 |
2017 |
2018 |
2019 |
|---|---|---|---|---|---|---|---|---|---|---|---|---|---|---|---|
|
Below poverty level pop |
298950 |
296303 |
286197 |
292607 |
312862 |
333530 |
336269 |
355132 |
364735 |
329678 |
336669 |
315557 |
298996 |
297610 |
289170 |
|
Labor participation rate |
49.5% |
47.4% |
49.6% |
49.0% |
49.6% |
49.3% |
50.2% |
50.6% |
50.2% |
47.5% |
45.7% |
45.9% |
42.5% |
44.9% |
45.0% |
|
Avg. labor participation rate |
47.79% |
47.79% |
47.79% |
47.79% |
47.79% |
47.79% |
47.79% |
47.79% |
47.79% |
47.79% |
47.79% |
47.79% |
47.79% |
47.79% |
47.79% |
|
Unemployment rate for poverty population |
28.7% |
26.7% |
30.8% |
24.4% |
30.6% |
36.1% |
36.0% |
31.9% |
30.1% |
31.7% |
30.1% |
27.6% |
23.8% |
24.7% |
22.7% |
|
Avg. unemployment rate |
7.6% |
6.3% |
6.2% |
6.7% |
9.4% |
10.1% |
9.8% |
8.8% |
8.5% |
7.6% |
6.5% |
5.9% |
5.2% |
5.0% |
5.5% |
To understand Mississippians’ average income and poverty relationship, the various components of income must be examined. A person’s or household’s income can have various sources, such as wages or salaries, retirement income, social subsidies, etc. Table 1 presents the average household income from each income source in 2019 and the percent change in those sources from 2017 to 2019.
|
Income source |
2019 |
% change from 2017 |
||
|
MS |
U.S. |
MS |
U.S. |
|
|
Wage or salary |
$64,048 |
$88,251 |
2.5 |
4.3 |
|
Self-employment |
$33,578 |
$39,154 |
-2.7 |
2.8 |
|
Interest, dividends, or net rental |
$18,810 |
$22,434 |
16.4 |
8.2 |
|
Social Security |
$18,140 |
$19,792 |
1.9 |
1.1 |
|
Supplemental security |
$9,503 |
$10,073 |
-0.7 |
-0.9 |
|
Public assistance |
$2,677 |
$3,163 |
-4.7 |
-6.1 |
|
Retirement |
$23,361 |
$27,793 |
4.0 |
3.3 |
|
Other types |
$11,170 |
$12,929 |
6.5 |
5.4 |
The major income source of households in Mississippi is wage or salary income. The average income from investments (i.e., interest, dividends, or net rental) significantly increased in both Mississippi and the U.S. by 16.4 percent and 8.2 percent, respectively, while the average income from public subsidies decreased by 4.7 percent (Mississippi) and 6.1 percent (U.S.) from 2017 to 2019. (However, it is not known whether people receiving public subsidies began receiving other types of income such as wages or salaries or if they were removed from the public assistance rolls, thus increasing the burden of poverty for the state). For most income sources, Mississippi presents the same patterns of change as the national level. However, income from self-employment in Mississippi declined by 2.7 percent, while income from self-employment in the U.S. increased by 2.8 percent. The positive change in average income from retirement might be explained by increasing aging populations.
While income provides one insight into the economic well-being of Mississippians, another valuable insight can be gained from the examination of net worth or wealth. Net worth is the measure of the value of assets held by a household minus its liabilities. As shown in Table 2, the average net worth for a household in Mississippi is $213,525, while the average net worth in non-Mississippi states is $546,140 in 2017. A non-Mississippi household’s average net worth is 2.6 times higher than a household in Mississippi. Furthermore, 26.9 percent of Mississippi households had zero or negative net worth in 2017, whereas only 16.5 percent of households in other states had this level of net worth.
|
Year |
Mississippi |
Non-Mississippi |
||
|---|---|---|---|---|
|
Net worth (Mean) |
Zero or Negative Net Worth |
Net worth (Mean) |
Zero or Negative Net Worth |
|
|
2013 |
$194,568 |
17.2% |
$391,580 |
17.6% |
|
2017 |
$213,525 |
26.9% |
$546,140 |
16.5% |
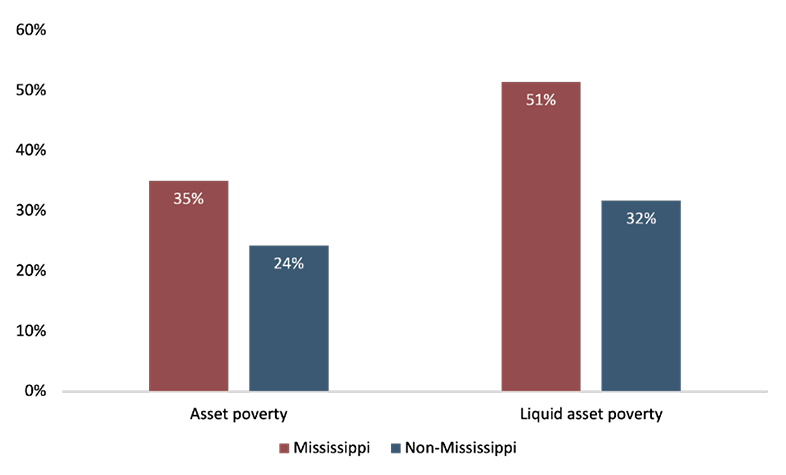
The asset and liquid asset poverty rates indicate the ability of a household’s asset accumulation to provide a financial safety net (defined by Prosperity Now Scorecard, 2018). The asset poverty rate is the percentage of households without sufficient net worth to subsist at the poverty level for three months during a financial crisis, such as job loss, medical emergency, or the need to fix a car. Liquid assets include cash on hand or an asset that can be readily converted to cash (such as bank accounts, other interest-earning accounts, equity in stocks and mutual funds, and retirement accounts). Liquid assets are important to maintain long-term financial well-being during a financial setback. If the household does not hold sufficient liquid assets, there is a high chance of losing key wealth-building assets, such as a home or business. Figure 7 reveals that 35 percent of Mississippi households were classified as being asset-poor as compared to 24 percent of non-Mississippi households in 2018. The asset poverty rate shows that Mississippians are less prepared for financial emergencies than non-Mississippians.
Note: The number of Mississippi survey samples is 800 and 348 in 2014 and 2018 SIPP data, respectively. Person weights (WPFINWGT) are applied to the survey data.
|
|
Mississippi |
Non-Mississippi |
|---|---|---|
|
Asset poverty |
35% |
24% |
|
Liquid asset poverty |
51% |
32% |
The liquid asset poverty rate reveals the percentage of households that cannot address a financial crisis quickly and easily. Liquid assets are those assets that can be converted to cash very quickly such as checking and savings accounts, money market accounts, and stock and bond portfolios. Fifty-one percent of households in Mississippi suffered from liquid asset poverty in 2018; this means that over half of the households in Mississippi do not have sufficient liquid assets to face unexpected financial hardship, while 32 percent of non-Mississippi households face this issue.
Liquid assets are more critical than fixed assets when the household falls into a financial crisis because fixed or long-term assets, such as houses or vehicles, generally require time to sell. Therefore, many households in Mississippi easily fall into economic vulnerability due to financial inflexibility without sufficient liquid assets. For example, when a household in liquid asset poverty faces an event such as unemployment, physical accidents, or loss of property from a natural disaster, the household is likely to suffer from a financial crisis for a longer time than would a household that has sufficient liquid assets to meet the immediate financial obligations resulting from the event.
Understanding asset and debt holdings by households provides insights into the differences in net worth and financial security between Mississippian and non-Mississippian households. Table 3 presents a comparison of asset share by component between Mississippi and the rest of the country. Notably, the home and vehicle are the main components of household assets. In Mississippi, these occupy 40.4 percent and 27.3 percent, respectively, in 2017. In non-Mississippi households, homes and vehicles occupy 35.3 percent and 18.0 percent of assets, respectively.
|
Asset type |
Mississippi |
Non-Mississippi |
||
|---|---|---|---|---|
|
2013 |
2017 |
2013 |
2017 |
|
|
Home |
43.0% |
40.4% |
37.7% |
35.3% |
|
Vehicle |
23.9% |
27.3% |
19.1% |
18.0% |
|
Financial institutions |
11.8% |
10.8% |
13.8% |
15.6% |
|
Retirement account |
10.4% |
12.4% |
14.7% |
17.2% |
|
Other investment |
4.0% |
2.6% |
4.1% |
3.0% |
|
Business |
2.1% |
1.7% |
2.8% |
3.0% |
|
Money market |
1.4% |
1.2% |
3.0% |
3.3% |
|
Other real estate |
1.2% |
1.5% |
1.6% |
1.8% |
|
Rental property |
1.0% |
1.8% |
2.2% |
2.1% |
|
Bond |
0.1% |
0.4% |
0.4% |
0.4% |
|
Educational savings account |
0.1% |
0.1% |
0.2% |
0.2% |
Households in Mississippi spend or invest proportionally more into non-liquid (fixed) assets (homes, vehicles, businesses, other real estate, rental property, and educational savings accounts). Mississippi households hold fewer financial assets (27.7 percent of total assets) than non-Mississippi households (36 percent of total assets). This suggests that Mississippi has lower levels of investment income from financial assets even though the household income from interest or dividends increased (See Table 1). This is consistent with the liquid asset poverty rates shown in Figure 7; the assets in financial institutions and retirement accounts make up only 23.2 percent in Mississippi and are a smaller percentage of total assets than the typical non-Mississippi household, which holds 32.8 percent of its assets in these categories. Non-Mississippi households also have a higher level of net worth, which may allow them to further diversify their assets.
When we study the economic state of households, we also need to look at the level and components of debt. Table 4 shows that in 2017, home and auto loans were reported as 49.0 percent and 55.3 percent of total household debts in Mississippi and non-Mississippi, respectively. Mississippi households have 4 percentage points more in vehicle debt than non-Mississippi households, while households in non-Mississippi states have 11 percentage points more in house debts.
Homes and vehicles are major debts as well as assets because these commodities are expensive to purchase and are typically deemed to be essential for family life. Therefore, most households get a loan to purchase a house or a car. The average household in Mississippi has a lower share of education or credit card debts (2 percentage points lower for each) than do non-Mississippi households. Unfortunately, these statistics could be explained by lower educational attainment levels and the use of alternative financial services such as payday loan companies. Many other debt component percentages are similar between Mississippi and non-Mississippi households.
|
Debt type |
Mississippi |
Non-Mississippi |
||
|---|---|---|---|---|
|
2013 |
2017 |
2013 |
2017 |
|
|
Home |
33.2% |
28.3% |
42.5% |
38.7% |
|
Vehicle |
22.3% |
20.7% |
15.8% |
16.6% |
|
Other debts |
15.0% |
3.7% |
8.1% |
3.2% |
|
Credit cards |
12.2% |
14.1% |
14.8% |
15.8% |
|
Educational debts |
10.3% |
10.1% |
11.9% |
12.1% |
|
Business |
3.8% |
1.6% |
1.8% |
1.9% |
|
Rental property |
1.4% |
21.8% |
2.7% |
2.4% |
|
Other real estates |
0.9% |
0.8% |
1.9% |
1.9% |
Home and vehicle debt generally lowers an individual’s net worth at the time of purchase, but these debts can be a future positive component of wealth as equity builds. Once they are paid off, these liabilities turn into assets (property). Debts from sources such as credit cards are incurred by spending without any positive value on wealth in the future. When the household faces a critical financial crisis, the owner can resell their home or vehicles to defend against it. However, if a household has too many debts, it is more likely to fall into a serious financial crisis because the amount of wealth that it has accumulated may not be sufficient to adequately address the crisis and future obligations.
The ability to set money aside and save is key to the financial security of a family. Table 5 reveals that 44.9 percent of Mississippi’s households have a savings account. Furthermore, 15.8 percent of households are unbanked, meaning they do not have a checking, savings, or money market account. The percentage of unbanked households had experienced a decline from 2009 to 2015, but began to rise again from 2015 to 2017. The rate of underbanked households in Mississippi (those households that have a bank account but still rely on alternative financial services) is an estimated 22.5 percent in 2017. Recently, the unbanked rate dropped significantly to 12.8 percent in 2019 and 11.1 percent in 2021 (FDIC, 2021).
|
Variable |
2009 |
2011 |
2013 |
2015 |
2017 |
|---|---|---|---|---|---|
|
Unbanked |
16.2 |
15.1 |
14.5 |
12.6 |
15.8 |
|
Underbanked |
- |
23.6 |
32.8 |
25.5 |
22.5 |
|
Savings accounts |
- |
51.8 |
49.4 |
48.7 |
44.9 |
|
Income volatility |
24.3 |
19.2 |
|||
|
Emergency savings |
50.6 |
46.9 |
Income volatility is a measure of a household’s degree of variation in their income. Income fluctuations may be addressed in a routine manner for some individuals and households, but may cause financial stress for others. Table 5 shows that 80.8 percent of households report that their income is roughly the same from month to month, while 19.2 percent indicate that their monthly income varies. Although some variability may be due to positive events, such as bonuses and investment income, the most likely reason their income varies is due to an irregular work schedule.
Emergency savings defines whether households saved for unexpected expenses or emergencies in the past 12 months. In Mississippi in 2017, 46.9 percent of households saved for emergencies, but this figure has declined since 2015. Each of these measures indicates room for improving the financial security of households in the state.
Unbanked and underbanked households typically rely on alternative financial services, such as pawn shops, payday loan stores, check-cashing services, car-title lenders, and rent-to-own stores. Mississippi is home to more than 1,000 of these businesses as consumer lending. This correlates to the high percentage of unbanked or underbanked households. In comparison, there are only 286 Subway restaurants in the state (Subway, n.d.).
Seven Mississippi counties have no alternative financial service businesses. Meanwhile, Hinds, Harrison, and DeSoto Counties each have over 50 alternative financial services available. The number of alternative financial services in a Mississippi county ranges from zero to 66. Figure 8 displays the number of alternative financial services available in each county per 10,000 residents. Forty-three of Mississippi’s 82 counties have more than three businesses offering these services per 10,000 people who live there. Availability of these alternative financial services could impact an individual’s banking use and preferences.

Note: Businesses categorized as consumer lending (North American Industry Classification System Code 522291) include, for example, finance companies (i.e., unsecured cash loans), personal credit institutions (i.e., unsecured cash loans), loan companies (i.e., consumer, personal, student, small), and student loan companies (North American Industry Classification System, n.d.). The Mississippi Department of Banking and Consumer Finance (DBCF) regulates 10 industries totaling 2,874 licensees. The industries include money transmitters, small loan businesses, check cashers, pawnbrokers, title pledge businesses, consumer loan broker, insurance premium finance businesses, motor vehicle sales finance businesses, credit availability businesses, and debt management service providers (DBCF, n.d.).
|
County |
Number of businesses |
Population |
Alternative financial services per 10,000 |
|---|---|---|---|
|
Adams |
14 |
31266 |
4.48 |
|
Alcorn |
15 |
37090 |
4.04 |
|
Amite |
1 |
12412 |
0.81 |
|
Attala |
10 |
18437 |
5.42 |
|
Benton |
0 |
8232 |
0.00 |
|
Bolivar |
12 |
31848 |
3.77 |
|
Calhoun |
7 |
14499 |
4.83 |
|
Carroll |
0 |
10070 |
0.00 |
|
Chickasaw |
6 |
17193 |
3.49 |
|
Choctaw |
3 |
8277 |
3.62 |
|
Claiborne |
4 |
9089 |
4.40 |
|
Clarke |
4 |
15770 |
2.54 |
|
Clay |
4 |
19640 |
2.04 |
|
Coahoma |
11 |
23255 |
4.73 |
|
Copiah |
5 |
28501 |
1.75 |
|
Covington |
6 |
18978 |
3.16 |
|
DeSoto |
53 |
178975 |
2.96 |
|
Forrest |
40 |
75224 |
5.32 |
|
Franklin |
0 |
7733 |
0.00 |
|
George |
6 |
23917 |
2.51 |
|
Greene |
0 |
13645 |
0.00 |
|
Grenada |
19 |
21088 |
9.01 |
|
Hancock |
14 |
46961 |
2.98 |
|
Harrison |
58 |
204502 |
2.84 |
|
Hinds |
66 |
238797 |
2.76 |
|
Holmes |
2 |
17737 |
1.13 |
|
Humphreys |
3 |
8389 |
3.58 |
|
Issaquena |
0 |
1361 |
0.00 |
|
Itawamba |
4 |
23462 |
1.70 |
|
Jackson |
29 |
142376 |
2.04 |
|
Jasper |
1 |
16505 |
0.61 |
|
Jefferson |
0 |
7225 |
0.00 |
|
Jefferson Davis |
2 |
11339 |
1.76 |
|
Jones |
24 |
68352 |
3.51 |
|
Kemper |
1 |
9943 |
1.01 |
|
Lafayette |
15 |
53590 |
2.80 |
|
Lamar |
18 |
61969 |
2.90 |
|
Lauderdale |
45 |
76279 |
5.90 |
|
Lawrence |
1 |
12633 |
0.79 |
|
Leake |
10 |
22792 |
4.39 |
|
Lee |
47 |
85072 |
5.52 |
|
Leflore |
15 |
29222 |
5.13 |
|
Lincoln |
17 |
34320 |
4.95 |
|
Lowndes |
22 |
59150 |
3.72 |
|
Madison |
36 |
104562 |
3.44 |
|
Marion |
13 |
24990 |
5.20 |
|
Marshall |
12 |
35599 |
3.37 |
|
Monroe |
10 |
35673 |
2.80 |
|
Montgomery |
5 |
10068 |
4.97 |
|
Neshoba |
11 |
29332 |
3.75 |
|
Newton |
5 |
21360 |
2.34 |
|
Noxubee |
3 |
10700 |
2.80 |
|
Oktibbeha |
19 |
49512 |
3.84 |
|
Panola |
14 |
34190 |
4.09 |
|
Pearl River |
23 |
55219 |
4.17 |
|
Perry |
1 |
12006 |
0.83 |
|
Pike |
19 |
39532 |
4.81 |
|
Pontotoc |
7 |
31618 |
2.21 |
|
Prentiss |
7 |
25255 |
2.77 |
|
Quitman |
4 |
7187 |
5.57 |
|
Rankin |
45 |
152677 |
2.95 |
|
Scott |
12 |
28332 |
4.24 |
|
Sharkey |
2 |
4404 |
4.54 |
|
Simpson |
11 |
26888 |
4.09 |
|
Smith |
0 |
16009 |
0.00 |
|
Stone |
6 |
18276 |
3.28 |
|
Sunflower |
9 |
26168 |
3.44 |
|
Tallahatchie |
2 |
14158 |
1.41 |
|
Tate |
8 |
28404 |
2.82 |
|
Tippah |
11 |
22018 |
5.00 |
|
Tishomingo |
5 |
19441 |
2.57 |
|
Tunica |
8 |
9988 |
8.01 |
|
Union |
8 |
28507 |
2.81 |
|
Walthall |
4 |
14477 |
2.76 |
|
Warren |
19 |
46519 |
4.08 |
|
Washington |
22 |
46057 |
4.78 |
|
Wayne |
11 |
20373 |
5.40 |
|
Webster |
3 |
9768 |
3.07 |
|
Wilkinson |
1 |
8875 |
1.13 |
|
Winston |
7 |
18229 |
3.84 |
|
Yalobusha |
3 |
12367 |
2.43 |
|
Yazoo |
10 |
28565 |
3.50 |
Conclusion
The concept of economic and financial well-being is complicated to measure. While it has been historically measured by GDP and GNP, new indicators of well-being are now recognized. This study provided an overview of the more traditional economic well-being measures such as poverty, income, and unemployment as well as contributed additional insight by analyzing labor force participation, net worth, asset and debt composition, banking status, financial security, and alternative financial services in Mississippi. These concepts are important to the state’s and region’s economic development efforts.
Poverty and deep poverty rates in Mississippi follow historical trends of being well above the national average. Similarly, Mississippians’ median household income is well below the U.S. median household income, with the gap being over $10,000 (about 20 percent of the median income) since at least 1995. Mississippians living in poverty also tend to have a much greater unemployment rate than the state’s
average. Furthermore, the population living in poverty has experienced a nearly 5 percentage point decline in labor force participation since 2005; this is likely due to an increase in the number of discouraged workers who drop out of the labor force.
Generating income and accumulating wealth are two ways in which households can improve their economic well-being. Most income for Mississippi households comes from wage and salary sources; however, self-employment and retirement also account for substantial income within the state. The average household net worth in Mississippi is less than half of the average of non-Mississippi households. Mississippi households have greater asset and liquid asset poverty, which puts them at a higher risk of financial insecurity.
As of 2017, nearly 16 percent of Mississippi households were unbanked and less than 50 percent had saved for emergencies and unexpected expenses in the last 12 months. The state is also home to over 1,000 alternative financial services. These are businesses that operate outside of federally insured banks and often cost more money to use.
Mississippi continues to experience financial distress at the household level compared to non-Mississippi states. These results can be used by state and local leaders and stakeholders to improve Mississippi’s economic well-being, a fundamental part of the state’s economic prosperity.
References
Annie E. Casey Foundation. 2021. 2021 Kids Count Data Book: 2021 State Trends in Child Well-Being.
Board of Governors of the Federal Reserve System. 2020. Report on the Economic Well-Being of U.S. Households in 2019, Featuring Supplemental Data from April 2020. (Link opens a PDF.)
Consumer Financial Protection Bureau. (n.d.). Quick Guide to the CFPB Financial Well-Being Scale. (Link opens a PDF.)
Consumer Financial Protection Bureau. (n.d.). Why financial well-being?
EMSI. 2021. Business Table [Data file].
Federal Deposit Insurance Corporation. 2021. FDIC National Survey of Unbanked and Underbanked Households Appendix Tables.
Fox, J. 2012. The Economics of Well-Being.
Hoynes, H., M. Page, & A. Stevens. 2005. Poverty in America: Trends and Explanations. National Bureau of Economic Research Working Paper Series.
Mississippi Department of Banking and Consumer Finance. (n.d.). Consumer Finance.
North American Industry Classification System. (n.d.). NAICS Code Description.
Pew Research Center. 2014. The Rising Cost of Not Going to College.
Prosperity Now Scorecard. 2018. Financial Assets and Income.
Subway. (n.d.). Subway Locations in Mississippi.
U.S. Bureau of Labor Statistics. 2015. How the Government Measures Unemployment.
U.S. Bureau of Labor Statistics. 2021. Unemployment Rates for States.
U.S. Census Bureau. 2021. American Community Survey (ACS) [Data file].
U.S. Census Bureau. 2021. Small Area Income and Poverty Estimates (SAIPE) Program [Data file].
U.S. Census Bureau. 2021. Survey of Income and Program Participation (SIPP) [Data file].
The information given here is for educational purposes only. References to commercial products, trade names, or suppliers are made with the understanding that no endorsement is implied and that no discrimination against other products or suppliers is intended.
Publication 3912 (POD-07-23)
By Mckenzie Boyce, PhD student, Agricultural and Applied Economics, University of Wisconsin-Madison; Ayoung Kim, PhD, Assistant Professor, Agricultural Economics; Rebecca Smith, PhD, Associate Extension Professor, Agricultural Economics; and Alan Barefield, PhD, Extension Professor, Agricultural Economics.

The Mississippi State University Extension Service is working to ensure all web content is accessible to all users. If you need assistance accessing any of our content, please email the webteam or call 662-325-2262.