
Business Employment by Age and Size of Firms in Mississippi
Key Takeaways
- Old (11 years or older) and large (with 100 employees or more) establishments support most jobs in Mississippi, indicating that they are stable sources of employment.
- Young and small establishments create most new jobs, demonstrating their importance as a resource for creating new employment opportunities.
- Mature (11 years or older) establishments with 19 employees or more are more likely to be located in urban counties than rural ones.
- Younger (10 years or younger) establishments with 19 employees or fewer are more likely to be located in rural areas than in urban areas.
Introduction
Business survival is strongly relevant to regional economic growth because its longevity ensures a stable supply of jobs in the region, contributing to the income of residents. Successful job creation and retention can mitigate poverty and raise income levels, which are goals of state economic development policy. Though the importance of business entities in creating jobs is widely known, what types of businesses (in terms of age and size) the state should foster is a matter of debate. The discussion highlights the difficulty in choosing between strategies like 1) attracting new large firms into the region, or 2) assisting the survival and growth of existing small firms. Analyzing the economic contributions of different types of establishments in the labor market might help identify the types of businesses that should get the most attention.
This publication presents an establishment profile for Mississippi, focusing on how businesses contribute to Mississippi’s labor market. We break down establishments into categories according to size and age, and assess their contribution to creating and retaining jobs. We also compare the profiles between Mississippi and the United States, and address how similar or different Mississippi profiles are from the U.S. average. Lastly, we illustrate how these establishment categories are distributed in three regions: rural, urban, and mixed. Data used in the analysis come from the Census Bureau’s Business Dynamics Statistics (BDS). It provides an annual number of establishments that opened, closed, or continued operations and jobs created and lost by those companies. The report reflects the annual status of businesses in 2020.
Business Employment by Age of Firms
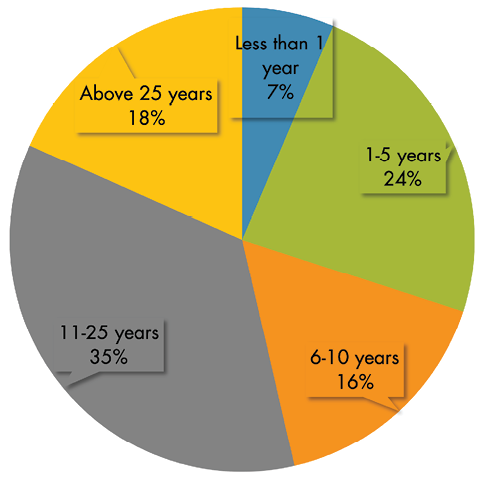
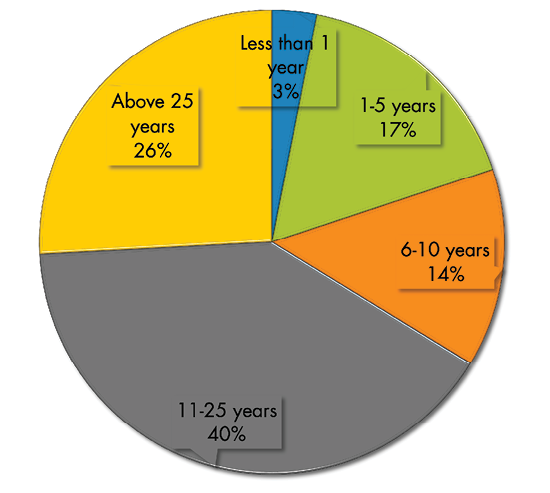
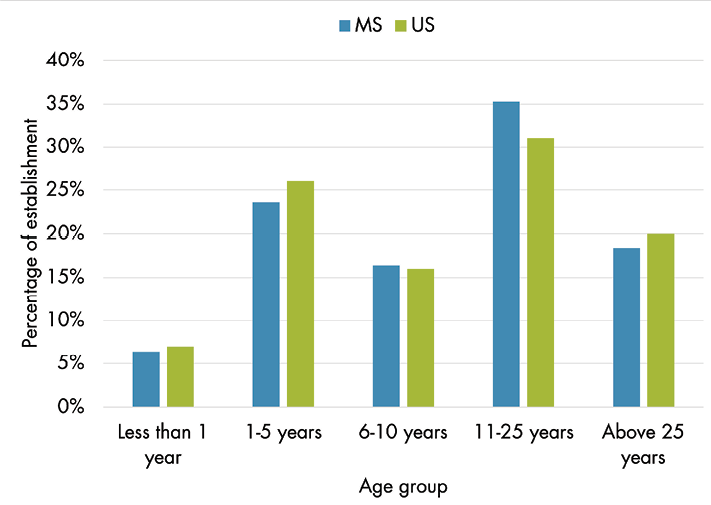
Figure 1 presents the share of establishments by five age groups on the left and the percentage of jobs supported by each group on the right in 2020. The establishment age is defined as the years since the firm was officially established until 2020. It shows that establishments aged between 11- 25 years accounted for 35 percent of establishments supporting 40 percent of jobs in 2020. Similarly, establishments older than 25 years represented 18 percent of establishments and supported one out of four jobs. Establishments older than five years supported 80 percent of jobs in 2020. It indicates that older establishments are Mississippi’s main source of employment.
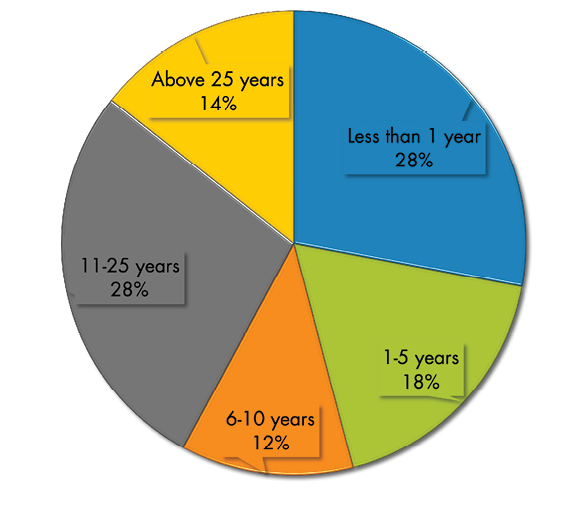
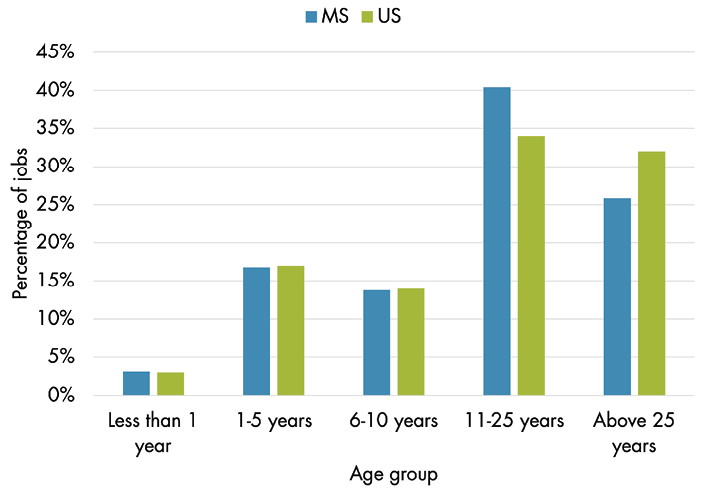
Startups under the age of one supported only 3 percent of jobs. However, they generated 28 percent of new jobs in the past 12 months, indicating that the entry of new establishments is essential to create new employment opportunities. Figure 2 shows the percentage of new jobs created in the last 12 months by business age group. Share of establishments, job support, and new job creation by four industry sectors (Manufacturing, Retail Trade, Health Care, and Food) are included in Table A1 in the Appendix.
The average number of jobs and new jobs per establishment, according to the age of the establishment, are shown in Table 1. The average job per establishment is steadily increasing with age. On average, a startup business younger than a year hired eight employees. Establishments older than 25 years employed 25 workers per establishment. The findings imply that older firms are a reliable source of jobs in Mississippi. Older establishments created less than two new jobs on average, but startups created eight new jobs on average, indicating that new firms are essential in generating new employment opportunities.
|
Age group |
Average jobs |
Average new jobs (last 12 months) |
|
Less than 1 year |
8 |
7.5 |
|
1–5 years |
12 |
1.3 |
|
6–10 years |
15 |
1.3 |
|
11–25 years |
20 |
1.4 |
|
Above 25 years |
25 |
1.4 |
|
Overall Average |
17 |
1.8 |
Data source: Business Dynamics Statistics, 2020, U.S. Census Bureau
Business Employment by Size of Firms
The size of an establishment is measured by the number of employees. Business Dynamics Statistics (BDS) categorizes establishments into six size groups based on the number of employees. Following the same classification, Figure 3 presents the share of establishments and job support according to the size group. The majority of establishments (70.4%) were small establishments that hired less than ten employees. About half of the establishments had less than five employees, and about 22 percent of establishments hired five to nine employees. Although small establishments with fewer than 10 employees represented a substantial share of 70.4 percent of total establishments, they only supported 15 percent of total jobs in Mississippi. However, this does not mean that small establishments are less important to the regional economy. They are crucial in creating new jobs, as shown in Figure 4. Twenty-seven percent of the new jobs in the last 12 months came from establishments with fewer than 10 employees.
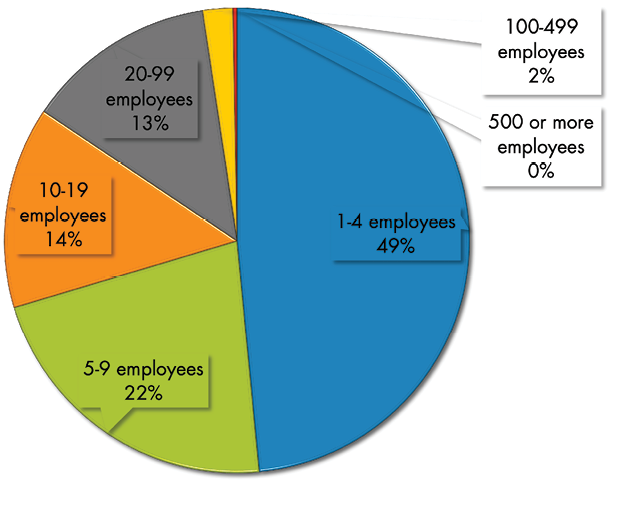
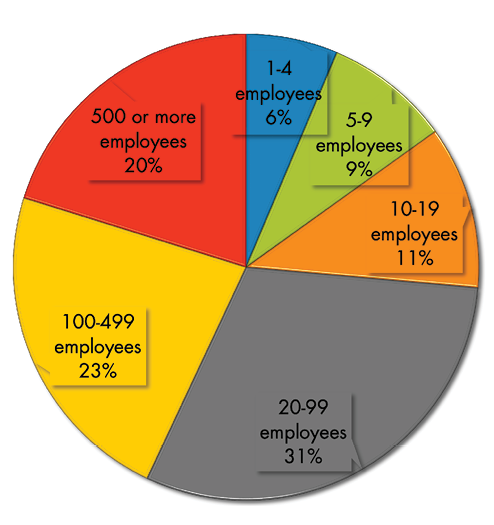
Of the 54,697 establishments actively operating in Mississippi in 2020, less than 1 percent were establishments that hired more than 500 workers. However, these establishments not only supported nearly 20,000 jobs (20 percent of total jobs) but also newly hired 10,000 jobs (11 percent of new jobs) within that year, indicating their importance in the Mississippi economy. Similarly, establishments with more than 100 employees supported 43 percent of jobs even though they represented only 2.3 percent of total establishments. These statistics indicate that those larger establishments are the main source of jobs in Mississippi, and are an essential part of the economy. The relevant information has been included in Table A2 in the Appendix.
Table 2 shows the average number of jobs and new jobs per establishment according to the size group. The average number of jobs per establishment increases steadily with size, which is intuitive since the classification of establishments is based on the number of employees. However, establishments with more than 500 employees should not be overlooked. The average number of jobs per establishment for this size group is 1,265. This statistic implies that the closure of larger establishments could lead to significant job loss in Mississippi and highlights that the survival of larger establishments is crucial to the regional economy.
|
Size group |
Average jobs |
Average new jobs (last 12 months) |
|
1–4 employees |
2 |
0.5 |
|
5–9 employees |
7 |
1.0 |
|
10–19 employees |
14 |
1.7 |
|
20–99 employees |
40 |
4.0 |
|
100–499 employees |
190 |
17.4 |
|
500 or more employees |
1,265 |
83.8 |
|
Overall Average |
17 |
1.8 |
Data source: Business Dynamics Statistics, 2020, U.S. Census Bureau
Comparison between the U.S. and Mississippi
This section compares Mississippi’s profile with national data to help understand Mississippi’s businesses in the macroeconomic context. Figure 5 compares the shares of establishments and their job support according to age group. In both Mississippi and the U.S., about half of the establishments are older than ten years. Business establishments aged 11 to 25 years are the largest group in both Mississippi and the U.S., and it was four percentage points higher in Mississippi in 2020. However, the share of establishments younger than six years is slightly lower in Mississippi than in the U.S. Establishments starting their business in the last 12 months were almost the same portion in Mississippi and the U.S. Sixty-six percent of Mississippi and U.S. jobs were supported by establishments older than ten years. Mississippi and the U.S. present slightly different shares by the groups, but overall, they have similar patterns in age groups.
|
Age group |
MS |
U.S. |
|
Less than 1 year |
6% |
7% |
|
1–5 years |
24% |
26% |
|
6–10 years |
16% |
16% |
|
11–25 years |
35% |
31% |
|
Above 25 years |
18% |
20% |
|
Age group |
MS |
U.S. |
|
Less than 1 year |
3% |
3% |
|
1–5 years |
17% |
17% |
|
6–10 years |
14% |
14% |
|
11–25 years |
40% |
34% |
|
Above 25 years |
26% |
32% |
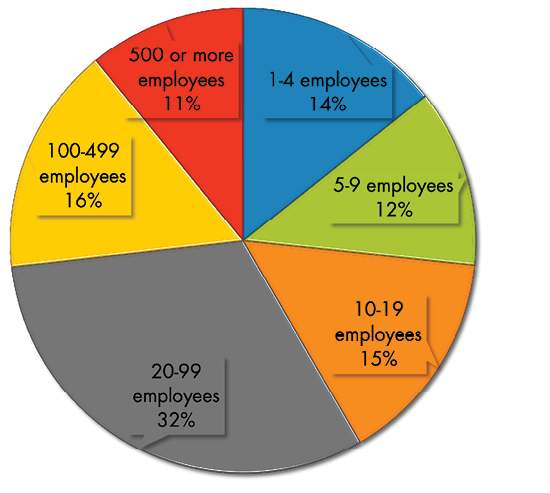
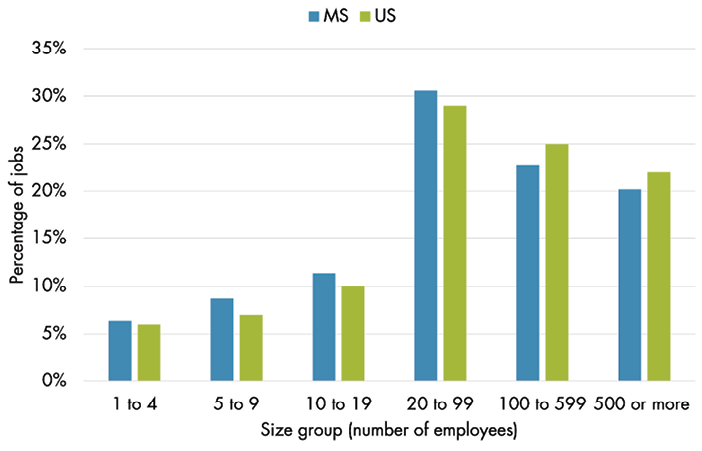
Figure 6 compares the share of establishments and job support according to size group. It shows that Mississippi and the U.S. have similar patterns by size group, but Mississippi is around 3 percent higher in the share of establishments with five to nine employees. The share of establishments with one to four employees is 2.5 percent lower in Mississippi than in the U.S. Establishments with more than 100 employees comprised 2.4 percent and 2.7 percent of establishments in Mississippi and the U.S., respectively. However, these establishments supported 43 percent of jobs in Mississippi and 47 percent of jobs in the U.S. In both instances, 85 percent of jobs are provided by establishments with more than ten employees. However, establishments with fewer than ten employees provide 15 percent of jobs in Mississippi and 17 percent in the U.S. Overall, there is no significant difference in the share of establishments and their job support by size and age between the national level and the state of Mississippi.
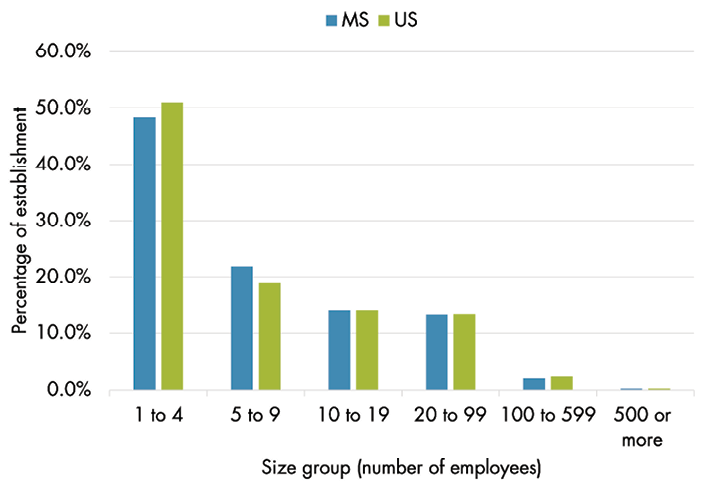
|
Size group |
MS |
U.S. |
|
1–4 |
48.5% |
51.0% |
|
5–9 |
21.9% |
19.0% |
|
10–19 |
14.0% |
14.0% |
|
20–99 |
13.3% |
13.3% |
|
100–599 |
2.1% |
2.4% |
|
500 or more |
0.3% |
0.3% |
|
Size group |
MS |
U.S. |
|
1–4 |
6% |
6% |
|
5–9 |
9% |
7% |
|
10–19 |
11% |
10% |
|
20–99 |
31% |
29% |
|
100–599 |
23% |
25% |
|
500 or more |
20% |
22% |
Urban, Mixed, and Rural Areas
This section compares the establishment profiles across areas in Mississippi: urban, rural, and mixed areas. Figure 7 compares the share of establishments among different areas based on four age groups. In the state-level data, five classes of age groups were reported. However, this figure is generated by aggregating the county-level data, in which only four classification levels are available: less than 1 year, 1 to 5 years, 6 to 10 years, and 11 or more years. It shows that 58 percent of establishments in urban counties are 11 years or older compared to 50 percent in rural counties, indicating that older establishments are more concentrated in urban areas. Conversely, half of establishments in rural counties are younger than 11 years compared to 42 percent in urban counties, indicating that younger establishments are slightly more concentrated in rural areas.
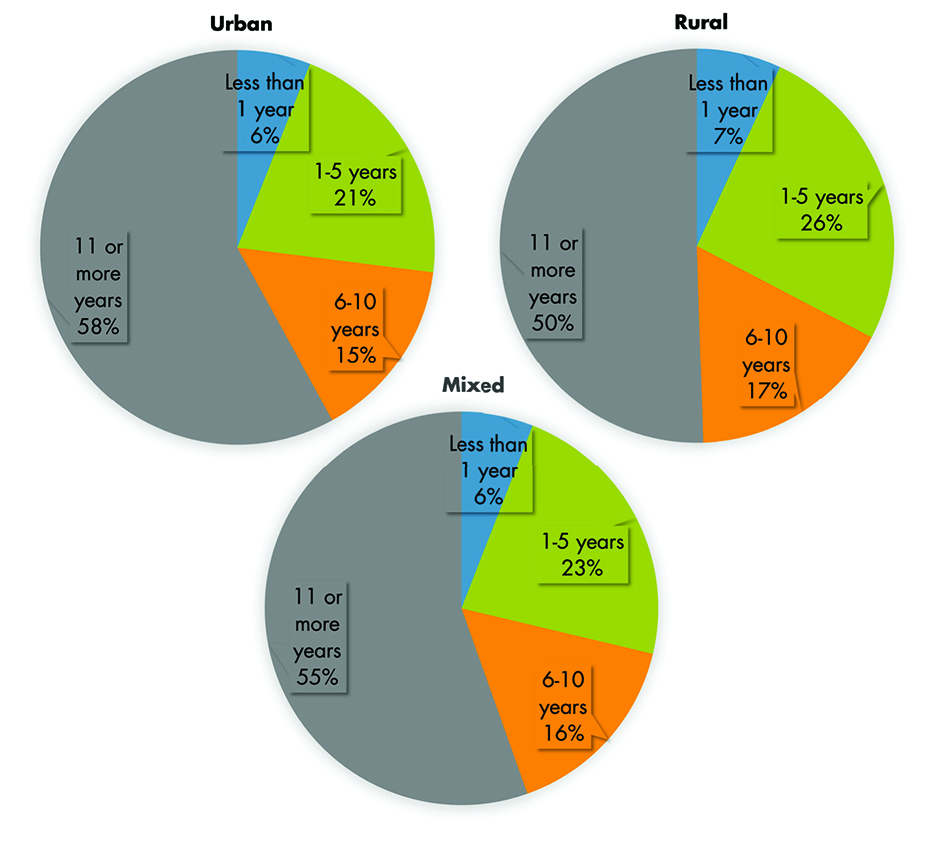
|
Age group |
Rural |
Urban |
Mixed |
|
Less than 1 year |
7% |
6% |
6% |
|
1–5 years |
26% |
21% |
23% |
|
6–10 years |
17% |
15% |
16% |
|
11 or more years |
51% |
58% |
56% |
Figure 8 compares the share of establishments among different areas based on three size groups. Six classes of age groups were reported in the state-level data, while county-level data only provided three levels: 1 to 19, 20 to 499, and 500 or more employees. It shows that 40 percent of establishments in urban counties have more than 19 employees compared to 33 percent in rural counties, indicating that larger establishments are more concentrated in urban areas. Conversely, 67 percent of establishments in rural counties have fewer than 11 years compared to 60 percent in urban areas, indicating that smaller establishments are slightly more concentrated in rural areas.
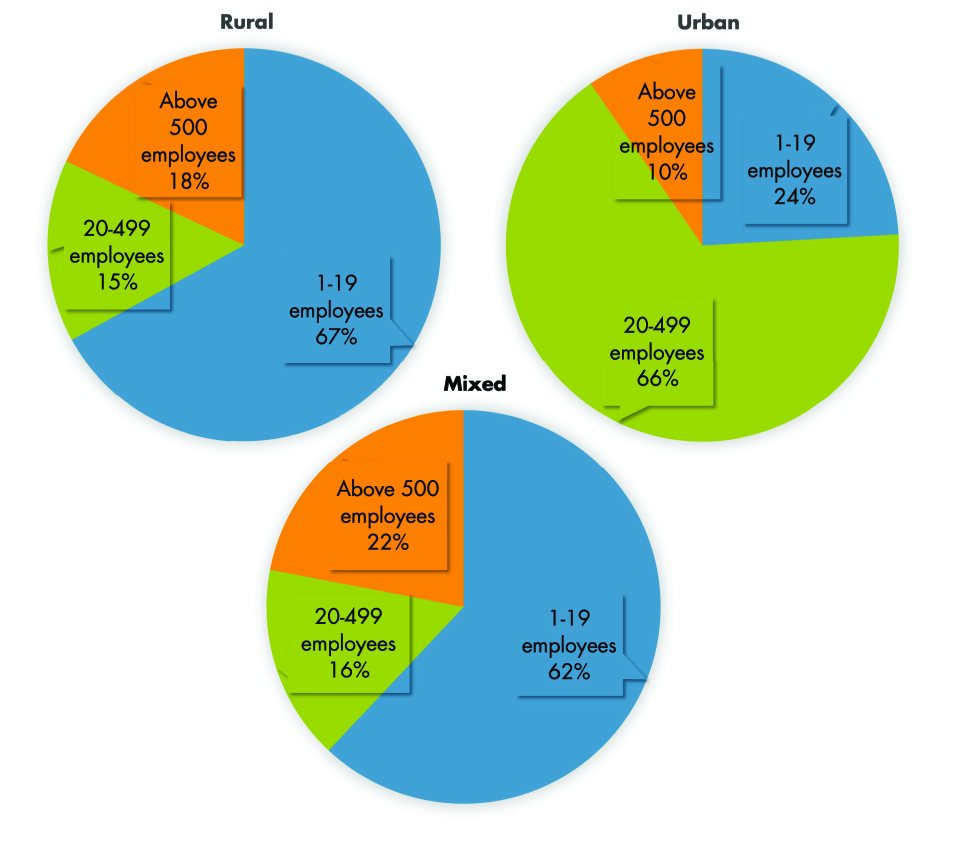
|
Size group |
Rural |
Urban |
Mixed |
|
1–19 employees |
67% |
60% |
62% |
|
20–499 employees |
15% |
165% |
16% |
|
Above 500 employees |
18% |
24% |
22% |
Conclusion
This publication has explored the characteristics of Mississippi establishments that are critical contributors to the state economy. Based on size and age, establishments are assessed for their contribution to job support and creation.
Larger and more mature establishments have been identified as the major sources of jobs. Smaller and younger establishments are major job creators. Establishments operating for 11 years or longer supported 66 percent of Mississippi jobs in 2020. Younger businesses created 58 percent of new jobs over the same year. It implies that helping establishments survive is vital to maintain a resilient labor market and regional economy.
Simultaneously, encouraging entrepreneurship is important for Mississippi to bolster a vibrant economy and accelerate economic growth. In urban and rural settings, we found that old (11 years or older) and large (with 19 employees or more) establishments are likely to be clustered in urban areas, while young (10 years or younger) and small (with 19 employees or fewer) establishments are likely to be concentrated in rural areas. Older or larger establishments benefit residents in urban areas by providing stable job opportunities, and younger or smaller establishments benefit rural areas by creating new jobs. Therefore, urban and rural communities may need different strategies for helping businesses foster a vibrant economy and maintain a resilient labor market. Economic development policy helps existing urban businesses survive and encourages rural entrepreneurs to establish businesses.
References
U.S. Census Bureau. 2020 Business Dynamics Statistics Data Tables.
USDA Economic Research Service. 2020. Rural-Urban Continuum Codes: 2013.
Appendix
|
Age Group |
Manufacturing |
Retail Trade |
Healthcare |
Food Industry |
All Sectors |
|||||
|---|---|---|---|---|---|---|---|---|---|---|
|
N |
% |
N |
% |
N |
% |
N |
% |
N |
% |
|
|
Less than 1 year |
78 |
5% |
558 |
6% |
371 |
6% |
464 |
9% |
3504 |
6% |
|
1–5 years |
266 |
16% |
2239 |
23% |
1506 |
26% |
1460 |
28% |
12909 |
24% |
|
6–10 years |
200 |
12% |
1714 |
17% |
990 |
17% |
980 |
19% |
8954 |
16% |
|
11–25 years |
636 |
38% |
3692 |
37% |
2063 |
35% |
1672 |
32% |
19293 |
35% |
|
Above 25 years |
482 |
29% |
1685 |
17% |
908 |
16% |
678 |
13% |
10037 |
18% |
|
Total |
1662 |
100% |
9888 |
100% |
5838 |
100% |
5254 |
100% |
54697 |
100% |
|
Age Group |
Manufacturing |
Retail Trade |
Healthcare |
Food Industry |
All Sectors |
|||||
|---|---|---|---|---|---|---|---|---|---|---|
|
N |
% |
N |
% |
N |
% |
N |
% |
N |
% |
|
|
Less than 1 year |
909 |
1% |
3275 |
3% |
2964 |
2% |
6609 |
5% |
29534 |
3% |
|
1–5 years |
7507 |
7% |
20020 |
16% |
25045 |
19% |
25500 |
20% |
159985 |
17% |
|
6–10 years |
8944 |
9% |
15940 |
13% |
16802 |
13% |
20271 |
16% |
131438 |
14% |
|
11–25 years |
42421 |
42% |
51539 |
42% |
50675 |
38% |
55687 |
43% |
385085 |
40% |
|
Above 25 years |
41569 |
41% |
33010 |
27% |
37839 |
28% |
22319 |
17% |
246124 |
26% |
|
Total |
101350 |
100% |
123784 |
100% |
133325 |
100% |
130386 |
100% |
952166 |
100% |
|
Age Group |
Manufacturing |
Retail Trade |
Healthcare |
Food Industry |
All Sectors |
|||||
|---|---|---|---|---|---|---|---|---|---|---|
|
N |
% |
N |
% |
N |
% |
N |
% |
N |
% |
|
|
Less than 1 year |
909 |
13% |
3275 |
29% |
2964 |
23% |
6609 |
37% |
26906 |
28% |
|
1–5 years |
720 |
10% |
2318 |
20% |
2985 |
23% |
2592 |
15% |
17219 |
18% |
|
6–10 years |
841 |
12% |
1267 |
11% |
1507 |
12% |
1870 |
11% |
11554 |
12% |
|
11–25 years |
2578 |
37% |
3035 |
26% |
3457 |
27% |
4655 |
26% |
26651 |
28% |
|
Above 25 years |
1881 |
27% |
1588 |
14% |
2036 |
16% |
2082 |
12% |
13835 |
14% |
|
Total |
6929 |
100% |
11483 |
100% |
12949 |
100% |
17808 |
100% |
96165 |
100% |
Note: Manufacturing, retail trade, health care and social assistance, and food and accommodation are the four sectors that are responsible for most jobs in Mississippi. Nearly half of the jobs in the state come from these sectors, with each sector contributing to at least 10% of jobs in 2020.
Data source: Business Dynamics Statistics, 2020, U.S. Census Bureau
|
Size Group |
Establishments |
Job Support |
New Jobs |
|||
|---|---|---|---|---|---|---|
|
N |
% |
N |
% |
N |
% |
|
|
1–4 employees |
26515 |
48.5% |
60619 |
6% |
13790 |
14% |
|
5–9 employees |
11982 |
21.9% |
83158 |
9% |
11869 |
12% |
|
10–19 employees |
7659 |
14.0% |
107680 |
11% |
14352 |
15% |
|
20–99 employees |
7248 |
13.3% |
291158 |
31% |
30391 |
32% |
|
100–499 employees |
1141 |
2.1% |
217252 |
23% |
15279 |
16% |
|
500 or more employees |
152 |
0.3% |
192299 |
20% |
10484 |
11% |
|
Total |
54697 |
100% |
952166 |
100% |
96165 |
100% |
Data source: Business Dynamics Statistics, 2020, U.S. Census Bureau
|
Region |
Counties |
|
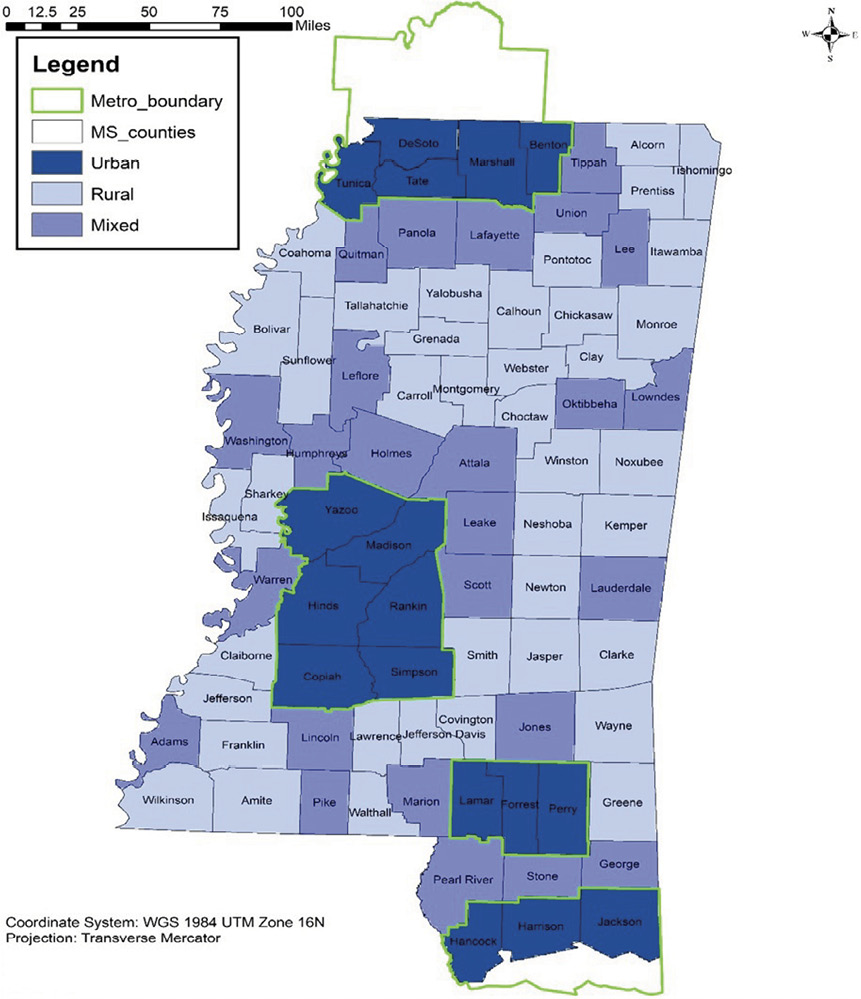
Rural (40 counties) |
Alcorn, Amite, Bolivar, Calhoun, Carroll, Chickasaw, Choctaw, Clairborne, Clarke, Clay, Coahoma, Covington, Franklin, Greene, Grenada, Issaquena, Itawamba, Jasper, Jefferson, Jefferson Davis, Kemper, Lawrence, Monroe, Montgomery, Neshoba, Newton, Noxubee, Pontotoc, Prentiss, Sharkey, Smith, Sunflower, Tallahatchie, Tishomingo, Walthall, Wayne, Webster, Wilkinson, Winston, Yalobusha |
|
Urban (17 counties) |
Benton, Copiah, Desoto, Forrest, Hancock, Harrison, Hinds, Jackson, Lamar, Madison, Marshall, Perry, Rankin, Simpson, Tate, Tunica, Yazoo |
|
Mixed (25 counties) |
Adams, Attala, George, Holmes, Humphreys, Jones, Lafayette, Lauderdale, Leake, Lee, Leflore, Lincoln, Lowndes, Marion, Oktibbeha, Panola, Pearl River, Pike, Quitman, Scott, Stone, Tippah, Union, Warren, Washington |
Data source: Rural–Urban Continuum Codes (RUCC) 2013, USDA ERS
The information given here is for educational purposes only. References to commercial products, trade names, or suppliers are made with the understanding that no endorsement is implied and that no discrimination against other products or suppliers is intended.
Publication 3868 (POD-06-23)
By Sabin Dawadi, Graduate Student, Agricultural Economics; Ayoung Kim, PhD, Assistant Professor, Agricultural Economics; and Alan Barefield, PhD, Extension Professor, Agricultural Economics.

The Mississippi State University Extension Service is working to ensure all web content is accessible to all users. If you need assistance accessing any of our content, please email the webteam or call 662-325-2262.