
Economic Impacts of Bacterial Beach Closures on the Mississippi Gulf Coast
South Mississippi is home to the beautiful Mississippi Gulf of Mexico coastline, with beaches running through Hancock, Harrison, and Jackson Counties. Many are drawn to these beaches—tourists and locals alike. However, they are not always safe for recreational activities. The three Mississippi coastal counties experience frequent bacterial beach closures and advisories. Because the Mississippi Gulf Coast area depends on tourism, its local economy experiences substantial adverse effects from these beach closures. This report found that frequent bacteria-related beach closures could reduce gross taxable tourism sales by $152 million (8 percent of total tourism sales) annually.
To protect beachgoers from harm, the Mississippi Beach Monitoring Program (MBMP) tests beach surface waters, as required by the Beaches Environmental Assessment and Coastal Health Act (BEACH Act) for marine water standards, and announces beach closures or advisories for high levels of Enterococcus (a genus of bacteria found in the lower digestive tracts of humans and many animals), hurricane debris, oil spills, harmful algal blooms, sewage pipe breaks, local water pump malfunctions, and more. A beach closure means that access to a beach and the water is not permitted, while an advisory means that access to the beach is allowed, but contact with the water is strongly discouraged.
Since 2000, the most common reason for beach closures and advisories has been high levels of Enterococcus, and the phenomenon has been growing worse in recent years. It can be found in coastal waters in many sources, including stormwater runoff, boating waste, animal droppings, swimmer fecal accidents, and sewer overflows. Its levels can be diminished through solar radiation, turbidity, and salinity; however, Enterococcus has been found to sustain itself longer when suspended in sediment or deposited in shoreline sand. For this reason, Enterococcus levels can rise after events that disturb underwater sediment or shorelines, such as wind, rain, sand dredging, and beach grooming. Although it is found in the intestines of healthy individuals, Enterococcus can cause such ailments as urinary tract infections, pelvic infections, pneumonia, meningitis, sepsis, ear infections, eye infections, gastrointestinal illness, and hepatitis.
While it is imperative to protect the health of beachgoers, frequent beach closures and advisories have an adverse economic result. When access to beaches is limited, tourists may be discouraged from traveling to the Mississippi Gulf Coast, which affects the local economy. This publication examines the impacts of frequent bacteria-related beach closures on local tourism businesses in Mississippi coastal counties.
The Tourism Industry on the Mississippi Gulf Coast
The Mississippi Gulf Coast area is tourism-dependent. Tourism expenditures for coastal Mississippi in 2019 were estimated to be $1.26 billion for overnight trips and $553 million for day trips, with ocean-based activities (beach activities, swimming, and fishing) accounting for 41 percent of visits. In 2021, tourist expenditures were valued at $6.7 billion for the state of Mississippi, with the coastal area being ranked as the top tourist destination in the state. The tourism industry (accommodation and food services and arts, entertainment, and recreation) in the Mississippi coastal counties makes up 17.2 percent of local employment, supporting 29,700 jobs as of 2021 (Table 1). It is the second-largest industry for employment in the region after government employment (22 percent). The Mississippi Gulf Coast area has a higher percentage of jobs in the tourism industry, as well as a larger contribution to regional gross domestic product (GDP) as compared to the state. Because of this reliance on tourism, beach closures can have substantial adverse economic effects on the local economy.
|
Accommodation and Food Services |
Arts, Entertainment, and Recreation |
|||
|---|---|---|---|---|
|
Gulf Coast |
MS |
Gulf Coast |
MS |
|
|
Regional GDP (million) |
$1,310 (7.59%) |
$4,914 (3.93%) |
$100 (0.58%) |
$509 (0.40%) |
|
Jobs |
27,327 (15.86%) |
118,565 (10.02%) |
2,224 (1.29%) |
10,317 (0.87%) |
Beach Closures
Beach closure data are obtained from the Mississippi Beach Monitoring Program (MBMP), which includes 21 surface water monitoring stations across the three Mississippi coastal counties shown in Figure 1. Harrison County has significantly more beach monitoring stations (13 stations) than the other two counties (four stations each). The data provide the locations (county and station), causes, and start/end dates of all beach closures and advisories in these counties since 2000.
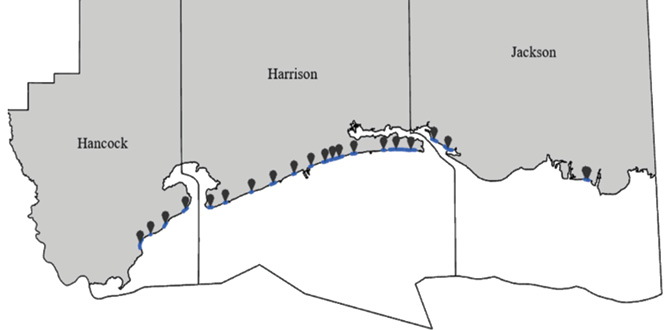
Source: Mississippi Beach Monitoring Program
Figure 2 shows the total days of beach closures and advisories by reason on the Mississippi Gulf Coast between 2000 and 2021. It shows that high levels of Enterococcus bacteria have been the major reason for beach closures over the program’s 22 years. During this period (approximately 8,030 days), Enterococcus-related beach closures occurred on 7.74 percent of days, and bacterial advisories occurred on 7.34 percent of days.
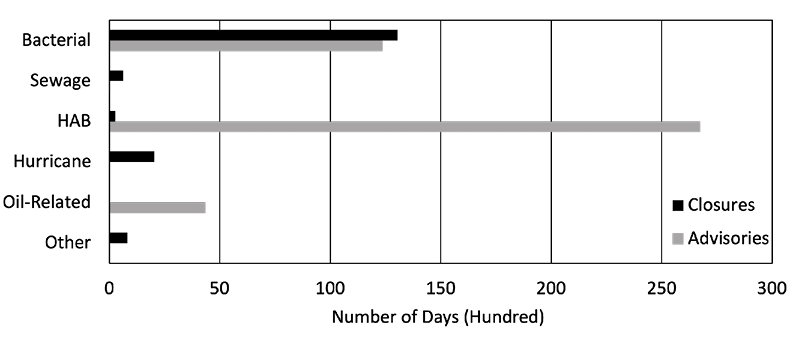
Note: The total event days are calculated by summing the number of affected monitoring stations. For example, if a single event occurred for 2 days in an area spanning four monitoring stations, and each station issued its own beach closure (four closures), then the total days accounted for in Figure 2 would be 8 (4 closures 2 days) for that single event.
Data source: Mississippi Beach Monitoring Program
|
Reason |
Advisories |
Closures |
|---|---|---|
|
Other |
0.04 |
8.11 |
|
Oil-Related |
43.44 |
0 |
|
Hurricane |
0 |
20.31 |
|
HAB |
267.36 |
2.7 |
|
Sewage |
0.31 |
6.28 |
|
Bacterial |
123.78 |
130.47 |
While harmful algal blooms (HABs) have more days of advisory than high levels of Enterococcus, they are less frequent. From 2000 to 2001, there were 131 HAB-caused advisories, and a small handful spanned several years, causing a high number of advisory days. On the other hand, there were 902 Enterococcus-related advisories, making them more frequent than HABs. Though it has fewer advisory days than HABs, Enterococcus remains the focus of this study due to its high number of closure days.
The third highest reason for beach advisories was oil-related incidents at 2.58 percent of days between 2000 and 2021, mostly from the 2010 BP Deepwater Horizon oil spill. Hurricane events caused only beach closures with no advisories, most likely due to their modes of danger (aerosol spray and beach debris). Sewage and other events resulted in a relatively low number of beach closure days (0.37 percent and 0.48 percent of days, respectively) and an insignificant number of beach advisory days (0.02 percent and 0.002 percent of days, respectively).
Note that eight out of the twelve “other” observations are actually sewer-related. Since sewage contains Enterococcus bacteria, all sewage-related events are also included in this analysis. Bacterial and sewage data are separated in MBMP data because sewage events incur the assumption of Enterococcus contamination following a pipe break or leak, while “bacterial” events indicate high levels of Enterococcus detected from monitoring surface waters with no point-specific origin. For the purpose of this analysis, this separation is unnecessary as both the assumption of Enterococcus contamination from a source and the confirmation of Enterococcus contamination via testing have the same result: beach advisory and/or closure.
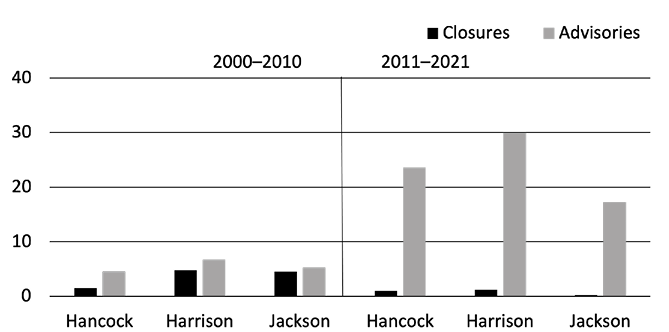
Note: This is the average frequency of beach closures or advisories, not number of days of events. For example, a county with eight days of closure between two events would be presented as two closures.
Data source: Mississippi Beach Monitoring Program
|
Period |
County |
Closures |
Advisories |
# stations |
Total closures |
Total advisories |
|---|---|---|---|---|---|---|
|
2000–2010 |
Hancock |
1.50 |
4.5 |
4 |
6 |
18 |
|
Harrison |
4.77 |
6.7 |
13 |
62 |
87 |
|
|
Jackson |
4.50 |
5.3 |
4 |
18 |
21 |
|
|
2011–2021 |
Hancock |
1.00 |
23.5 |
4 |
4 |
94 |
|
Harrison |
1.23 |
30.0 |
13 |
16 |
390 |
|
|
Jackson |
0.25 |
17.3 |
4 |
1 |
69 |
Figure 3 compares the average number of bacteria-related beach closures and advisories per station across counties over the two decades. In the past 11 years (2011–2021), the number of beach closures related to Enterococcus (bacterial and sewage) has declined compared to 2000–2010, but beach advisories for all three counties have considerably increased. All three counties experienced increases in advisories over the 2010–2021 period. Hancock advisories increased by 422.2 percent (4.5 to 23.5 per station and 18 to 94 in total), Harrison advisories increased by 348.3 percent (6.7 to 30 per station and 87 to 390 in total), and Jackson advisories increased by 228.6 percent (5.3 to 17.3 per station and 21 to 69 in total). With more frequent advisories, beach-going tourists could be discouraged from traveling to the area. Harrison County has more closures and advisories than the other two counties, which could be of concern.
Impact of Beach Closure on the Regional Tourism Industry
One way to measure the effects of an economic incident on a tourism-based regional economy is by analyzing the level of taxable sales in the tourism industry. Figure 4 presents average monthly gross taxable sales over about 8 years (October 2013 to August 2021), from the Mississippi Department of Revenue’s “Sales Indicated by Gross Sales Tax Collections, reported by County, City and Industry Group.” This data is reported by taxpayers each month (the current month’s tax report is based on the previous month’s sales). The gross taxable sales by industry and county are recorded monthly for September 2013 to July 2021 (reported in October 2013 to August 2021).
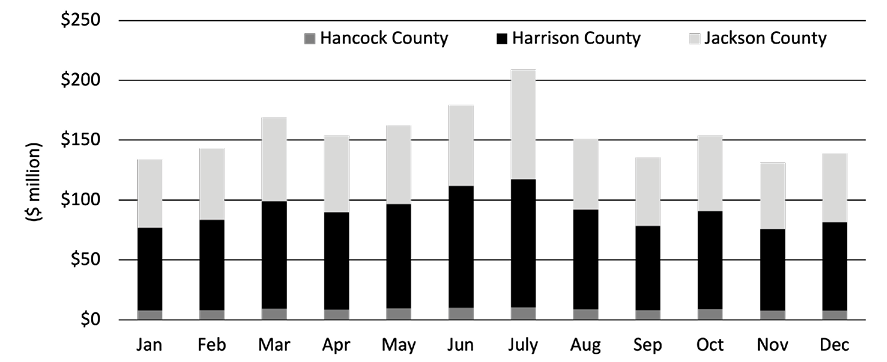
Note: Sales amounts are adjusted for inflation in August 2021 dollars using the Bureau of Labor Statistics Inflation Calculator (https://www.bls.gov/data/inflation_calculator.htm).
Data source: Mississippi Department of Revenue
|
Sales (1000K) |
Hancock County |
Harrison County |
Jackson County |
Total for month |
|---|---|---|---|---|
|
Jan |
7.7 |
68.9 |
57.5 |
134.0 |
|
Feb |
8.1 |
75.3 |
59.9 |
143.3 |
|
Mar |
9.4 |
89.5 |
70.2 |
169.0 |
|
Apr |
8.5 |
81.3 |
64.2 |
154.0 |
|
May |
9.5 |
86.9 |
65.8 |
162.3 |
|
Jun |
10.0 |
101.8 |
67.7 |
179.4 |
|
July |
10.6 |
106.8 |
91.5 |
208.8 |
|
Aug |
8.7 |
83.2 |
59.0 |
150.9 |
|
Sep |
8.1 |
70.4 |
56.9 |
135.4 |
|
Oct |
9.0 |
81.6 |
63.4 |
153.9 |
|
Nov |
7.5 |
68.3 |
55.3 |
131.0 |
|
Dec |
7.5 |
73.8 |
57.8 |
139.1 |
|
Total for county |
104.5 |
987.5 |
769.0 |
1861.1 |
|
Average for county |
8.7 |
82.3 |
64.1 |
155.1 |
Harrison County has the highest monthly average of gross tourism sales at $82.3 million. This is likely explained by the many large hotel-casinos and a larger number of maintained public beaches in the county. Harrison County is followed by Jackson County with monthly average gross taxable tourism sales of $64.1 million, and Hancock County has the lowest monthly average of $8.7 million. The combined Mississippi Gulf Coast monthly average of gross taxable tourism sales is $155.1 million. Tourism-related sales in this region can vary throughout the year, with the highest proportion occurring from March to July. Note that during the period of study, the COVID-19 pandemic led to a recession from March to May of 2020. March 2020 realized a 21 percent decrease in tourism-related sales from the pre-pandemic (2013–2019) average, while April and May of that year saw decreases of 49 percent and 15 percent, respectively.
Because beach advisories occur nearly every month, estimating their effect on monthly sales is challenging. For this reason, our analysis focuses on beach closures. To measure the effect of beach closures on local tourism businesses, monthly gross taxable tourism sales for the region are separated into two categories: safe water months and unsafe water months. Safe water months are defined as months in which the total number of bacterial beach closure days is less than the average bacterial beach closure days for that month (Column A in Table 2). Unsafe water months are defined as months in which the total number of bacterial beach closure days is greater than the average for that month. Table 2 shows the average monthly gross sales in each category and the average sales gap between unsafe and safe months.
Table 2 shows a negative gap between the average monthly gross sales for almost all months (excluding June and November). This means the Mississippi Gulf Coast region is likely to have lower gross taxable sales in the tourism industry when the water is unsafe. The largest negative effect is seen in July and September, with a gap of $27 million and $34 million, respectively, and the smallest effect is seen in October, with a gap of $1.4 million. The reverse impact in June and November still needs to be explained, although the impact is relatively smaller than the negative impact. The overall effect of bacterial beach closures on the Mississippi Gulf Coast contributed to a reduction of $152 million in gross taxable tourism sales annually. Note: The estimated average gap could be underestimated during the months of April to June of 2020. Tourism sales unusually decreased due to COVID-19 and the lockdown. Considering there were no beach closures reported over this period, the estimated tourism loss due to bacterial beach closures could be slightly larger than the estimate.
|
Month |
Average days of beach closure (A) |
Unsafe water month (B) |
Safe water month (C) |
Average sales gap (B - C) |
|---|---|---|---|---|
|
January |
7.1 |
122.4 |
137.9 |
-15.5 |
|
February |
3.5 |
131.4 |
145.0 |
-13.6 |
|
March |
3.5 |
154.5 |
171.1 |
-16.6 |
|
April |
3.5 |
138.6 |
156.2 |
-17.6 |
|
May |
3.5 |
148.2 |
164.3 |
-16.1 |
|
June |
4.4 |
186.1 |
177.2 |
9.0 |
|
July |
6.0 |
191.9 |
218.9 |
-27.0 |
|
August |
4.0 |
144.0 |
152.1 |
-8.1 |
|
September |
4.0 |
105.7 |
139.6 |
-33.9 |
|
October |
6.2 |
152.9 |
154.3 |
-1.4 |
|
November |
5.9 |
131.5 |
130.8 |
0.7 |
|
December |
3.5 |
128.2 |
140.6 |
-12.4 |
|
Annual |
1,735.5 |
1,887.9 |
-152.4 |
Conclusion
Enterococcus-related beach advisories and closures are becoming more frequent than they were in the past. On average, frequent bacteria-related beach closures are related to reduced gross tourism sales of $152 million annually, which is about 8 percent of total tourism sales in the region. While this estimate does not present a direct causal effect, it is evident that safe waters lead to more tourists. Higher tourism levels contribute to growing regional GDP through direct and indirect industry connections. Therefore, any efforts of community-based programs, policies, and strategies to keep water safe would result in regional economic benefits.
Beach grooming is a human-caused agitator of Enterococcus levels that could be reduced via public programs or policy, possibly leading to less frequent bacterial closures. Additionally, bacteria-related beach closures can be triggered by sewer overflows or sewer pipe breaks. Improvements to sewer infrastructure in the region could reduce sewer accidents, leading to fewer beach closures and higher tourism. Further study is needed to assess advisories and closures, controlling for compounding variables affecting the tourism industry, including market, environment, and climate factors.
References
Bureau of Economic Analysis. (2022). Regional economic accounts: Download gross domestic product (GDP) (Mississippi). Retrieved September 30, 2022.
Chenier, K. M., Gutierrez-Wing, M. T., Deng, Z.-Q., & Rusch, K. A. (2012). Environmental factors in-fluencing the abundance of Enterococci in Gulf Coast beach waters. Journal of Environmental Engineering, 138(11), 1130–1137.
Kelly, E. A., Feng, Z., Gidley, M. L., Sinigalliano, C. D., Kumar, N., Donahue, A. G., Reniers, A. J. H. M., & Solo-Gabriele, H. M. (2018). Effect of beach management policies on recreational water quality. Journal of Environmental Management, 212, 266–277.
Korajkic, A., Badgley, B. D., Brownell, M. J., & Harwood, V. J. (2009). Application of microbial source tracking methods in a Gulf of Mexico field setting. Journal of Applied Microbiology, 107(5), 1518–1527.
Longwoods International. (2019). Travel USA visitor profile, overnight visitation: Coastal Mississippi. Retrieved December 7, 2022.
Mississippi Beach Monitoring Program. (2022).
Mississippi Department of Employment Security. (2022). Tracking Mississippi’s Workforce state & metro trends: Data for March 2022. Retrieved: September 30, 2022.
Mississippi Development Authority. (2022). Key Indicators general fund tourism revenues state and local travel/tourism tax revenues/fees. Retrieved December 7, 2022.
Rabinovici, S. J. M., Bernknopf, R. L., Wein, A. M., Coursey, D. L., & Whitman, R. L. (2004). Economic and health risk trade-offs of swim closures at a Lake Michigan Beach. Environmental Science and Technology, 38(10), 2737–2745.
Lightcast. (2022). Regional comparison report, Q2 2022 data set. Retrieved September 30, 2022.
Russo, T. A., & Johnson, J. R. (2003). Medical and economic impact of extraintestinal infections due to Escherichia coli: Focus on an increasingly important endemic problem. Microbes and Infection, 5, 449–456.
Zhang, Z., Deng, Z., Rusch, K. A., & Walker, N. D. (2015). Modeling system for predicting enterococci levels at Holly Beach. Marine Environmental Research, 109, 140–147.
Publication 3949 (POD-11-23)
By Jessica Browne, Former Graduate Student, Ayoung Kim, PhD, Assistant Professor, Seong Yun, PhD, Associate Professor, and Benedict C. Posadas, PhD, Extension Professor, Agricultural Economics.

The Mississippi State University Extension Service is working to ensure all web content is accessible to all users. If you need assistance accessing any of our content, please email the webteam or call 662-325-2262.